One in ten data centers faces high risk from at least one climate hazard today. By 2050 it is one in six, with the sharpest rise in Southeast Asia, where heat is the main driver.
Key findings: Physical climate risk to data centers
- One in ten data centers already faces high climate risk. 864 of 8,707 sites (10%) are at High or Very High risk from at least one hazard today, even after accounting for local adaptation. That rises to 17% by 2050 and 24% by 2100.
- Risk rises fastest in Southeast Asia. Sites at High risk from at least one hazard go from 2 today to 396 by 2050, or 62% of the region.
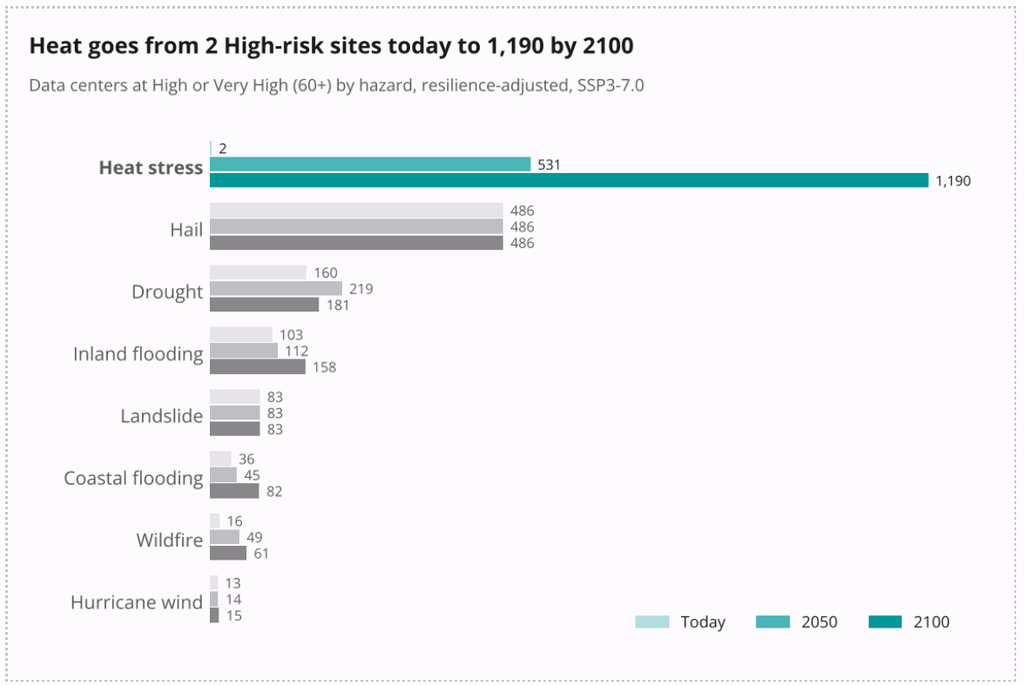
- Heat drives the increase. Sites at High heat risk go from 2 today to 531 by 2050 and 1,190 by 2100. Three in four of the 2050 heat-risk sites are in Southeast Asia.
- High-risk sites may lose twice as much value. Over a 10-year hold, climate impacts cut net present value by 14.3% at high-risk sites, against 6.7% elsewhere.
- Adaptation can reduce potential losses. On physical hazard alone, 3,822 sites (44%) would face High risk today. Once existing local defenses and community resilience are counted, that falls to 864 (10%), a 77% reduction. At the site level, further adaptation measures could recover about two-thirds of projected climate-driven NPV losses at high-risk sites.
- Some low risk sites may experience a larger change in financial impact. Sites with Very Low heat risk today may see cooling demand grow faster than sites already exposed to heat. For sites in Canada, Australia, France and Mexico, for instance, increases in cooling demand might exceed 4% a year, compared to 1-2% in historically heat-stressed regions like the Middle East.
Methodological summary
- Portfolio: 8,707 data centers in 142 countries, from Data Center Map.
- Scores: AlphaGeo resilience-adjusted risk scores, which credit local adaptation such as drainage, flood defenses and urban greenery. A site counts as High risk if any climate hazard scores 60 or above, following the AlphaGeo score card.
- Hazards: heat stress, drought, inland flooding, coastal flooding, hurricane wind, wildfire, hail and landslide.
- Scenario: SSP3-7.0 (medium-high emissions, CMIP6) unless stated, with SSP2-4.5 and SSP5-8.5 shown for comparison.
- Regions: follows UN regional groupings; the Middle East covers Western Asia.
- Financial metrics: equal-weighted by site, as no asset valuations were supplied.
Our approach: Resilience-adjusted risk and financial impact
Physical risk shows only part of the picture. Two sites with the same hazard exposure can fare very differently. One may sit behind a flood wall, near a reservoir and in a well-drained city, while the other has none of these infrastructural adaptations.
To move beyond from to true risk, AlphaGeo adopts a resilience-adjusted risk approach to risk modeling: we start from the physical hazard and adjust it by the adaptation capacity already in place locally. All figures in this report use our proprietary resilience-adjusted scores.
AlphaGeo’s standard resilience-adjusted risk framework adjusts physical hazard risk to account for:
- Local adaptation capacity: location-level infrastructure defenses, covering more than 20 engineered and nature-based measures, such as flood defenses, drainage, water storage, fire response and urban greenery.
- Societal resilience: captures the community’s capacity to cope and recover, measured by human development, investment levels and vulnerable populations.
- Asset remediation: building-level remediation capacity, with data provided by the asset owner or operator
This report uses a subset of that: resilience-adjusted risk that captures (1) local adaptation capacity and (2) societal resilience. We do not account for asset-level remediation in this analysis; interested readers can contact us at info@alphageo.ai to incorporate this asset-level lens.
We score each site for resilience-adjusted risk against eight climate hazards:
| Hazard | What we measure |
|---|---|
| Heat stress | Cooling degree days and unusually hot days |
| Drought | Water stress, dry spells and days above 40°C |
| Inland flooding | Heavy rainfall and river flood depth |
| Coastal flooding | Storm-surge flood depth, land subsidence and shoreline erosion |
| Hurricane wind | Extreme wind speeds |
| Wildfire | Burnable vegetation, dry spells and extreme heat |
| Hail | Damaging hail days per year |
| Landslide | Probability of a landslide |
High and Very High risk bands
A site is at High risk overall when it has High or Very High exposure to at least one of the eight hazards. Each hazard score is based on the expected damage to an asset (its mean damage ratio), so a High score reflects a real physical threshold. Refer to the AlphaGeo score card for specific hazard scoring thresholds.
How many data centers face high physical climate risk?
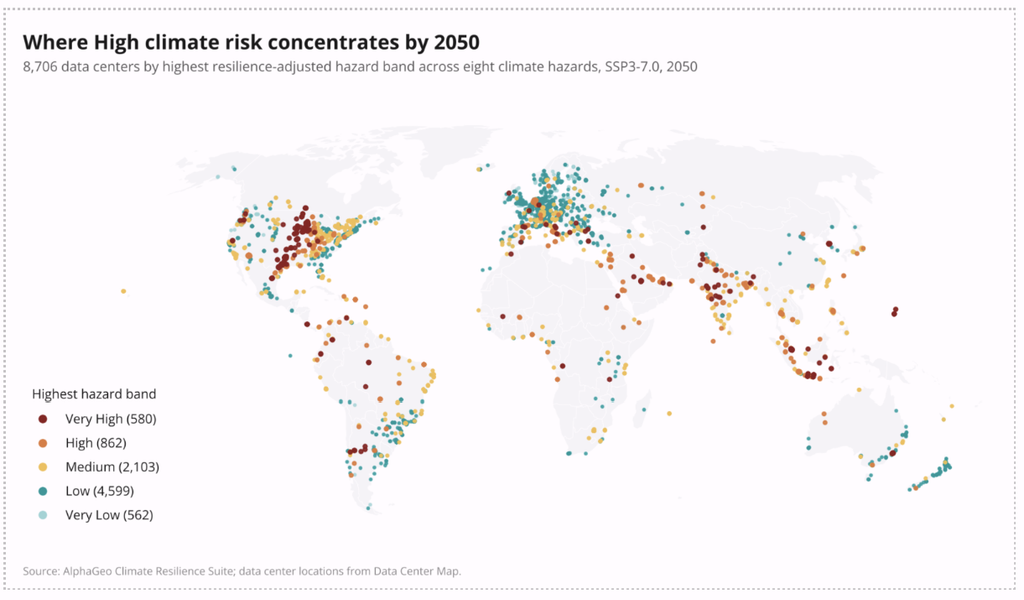
One in ten data centers is already at High risk. We scored 8,707 operating and planned data centers in 142 countries against eight climate hazards. Today, 864 (10%) score High or Very High on at least one hazard, even after crediting local defenses such as drainage, flood barriers and urban greenery. Half of those, 435 sites, are in the Very High band.
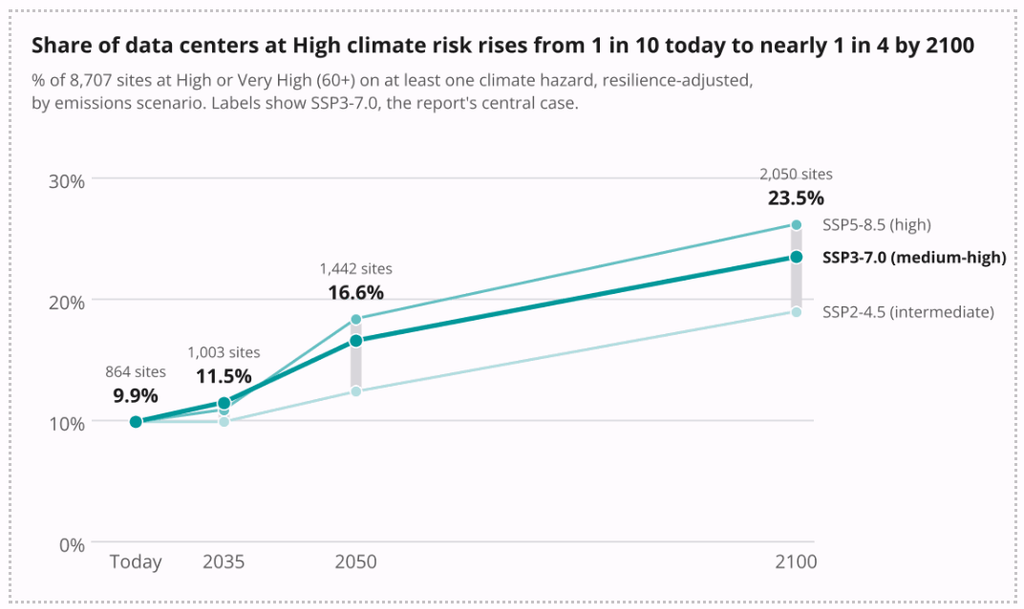
Under a medium-high emissions path (SSP3-7.0), the share climbs to 17% by 2050 and 24% by 2100. Even the intermediate path (SSP2-4.5) takes it to 12% by 2050. Most of the change happens after 2035, within the lifetime of assets being financed today.
Which regions’ data centers face the highest climate risk?
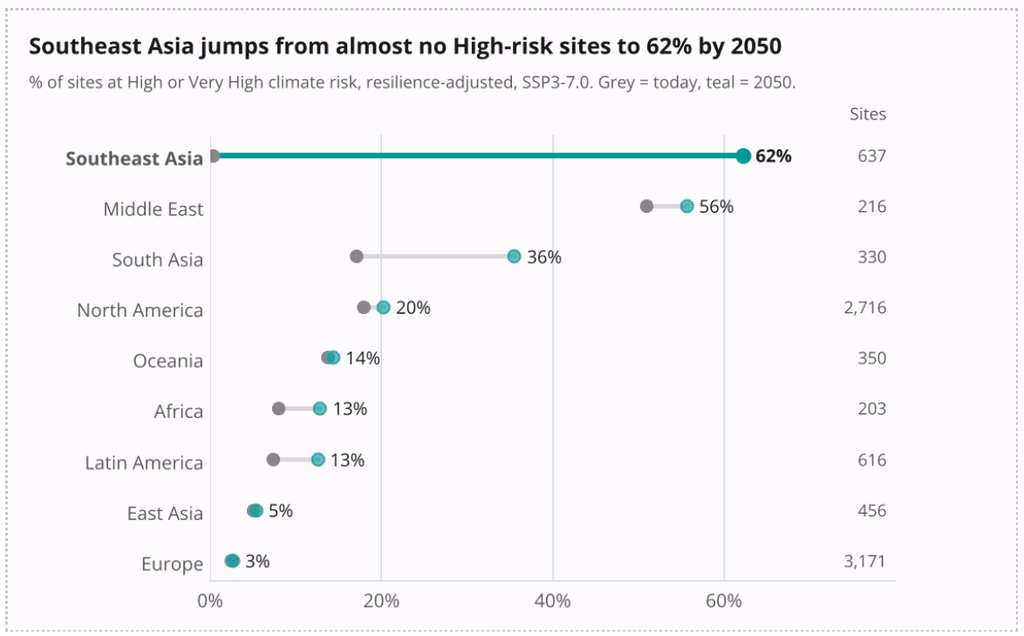
Risk is rising unevenly. By 2050, the share of sites at High risk more than doubles in South Asia and jumps across Southeast Asia, but remains stable in Europe, East Asia and North America.
| Region | Sites | High risk by 2050 | Main drivers, 2050 | Hotspots, 2050 (% of sites at High risk) |
|---|---|---|---|---|
Southeast Asia | 637 | 62% | Heat | Singapore 100%, Malaysia 79%, Thailand 62%, Philippines 60% |
| Middle East | 216 | 56% | Heat, drought | Saudi Arabia 100%, UAE 89% |
| South Asia | 330 | 36% | Drought, hail | Bangladesh 88%, India 26% |
| North America | 2,716 | 20% | Hail, drought | United States 22%, Canada 4% |
| Oceania | 350 | 14% | Landslide, heat | Australia 17%, New Zealand 1% |
| Africa | 203 | 13% | Heat, inland flooding | South Africa 0% |
Latin America | 616 | 13% | Heat, hail | Argentina 19%, Colombia 16%, Mexico 12% |
| East Asia | 456 | 5% | Inland flooding | South Korea 14%, Japan 3% |
| Europe | 3,171 | 3% | Coastal flooding, hail | Netherlands 15%, Italy 8% |
- Southeast Asia shows the sharpest shift. Local adaptation keeps all but 2 of its 637 sites below the High band today, but by 2050, warming pushes 62% over the line.
- Middle East has the highest share today (51%), because heat and drought risk in the region is already at the top of the scale. By 2050, every site in Saudi Arabia faces High risk from at least one climate hazard.
- South Asia more than doubles, from 17% today to 36% by 2050, as drought intensifies. Bangladesh is the hotspot at 88%.
- North America: about 20% of sites face High risk from at least one climate hazard. Hail accounts for 410 of the region’s 548 High-risk sites in 2050.
- Latin America and Africa climb steeply after 2050 as heat risk rises: to 43% and 34% of sites by 2100.
- Europe is the least-exposed region, with fewer than 3% of sites at High risk to 2050. Its risk is concentrated on the Dutch coast.
Which climate hazards pose the greatest risk to data centers?
Heat is the main driver of rising exposure. Few sites score High on heat risk today after accounting for local adaptation. By 2050, however, 531 sites will face High heat risk, three-quarters of them in Southeast Asia. By 2100 the number more than doubles again.
How does climate risk affect data center value and operating costs?
High-risk data centers lose twice as much value. Data centers are built to run without interruption, which makes them sensitive to physical risk. A flood can disable power systems and sever fiber connections; a heatwave can push cooling past its design limits and force servers offline. Morever, these represent only the acute impacts: chronic hazards such as heat stress also drive steady increases in operating costs, from cooling to routine maintenance.
How widespread are the financial impacts?
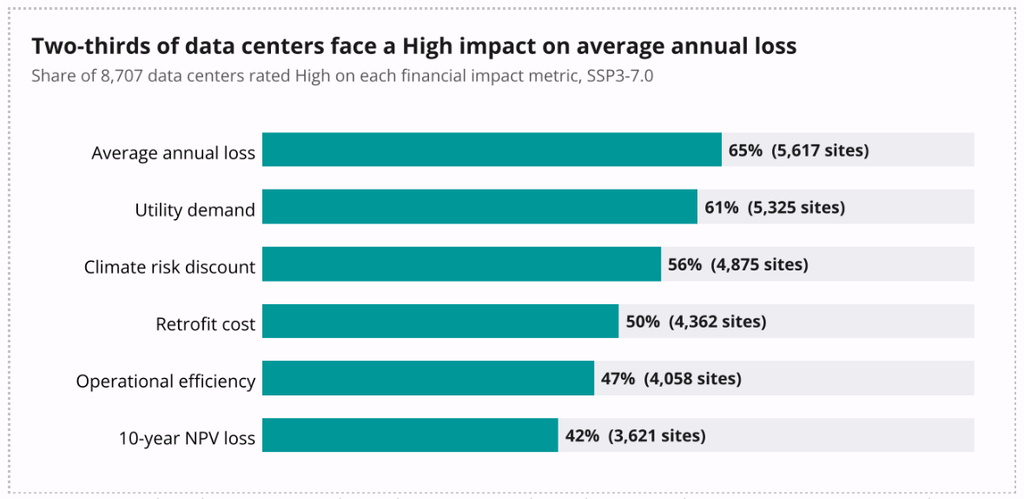
Climate costs are not confined to the most exposed sites. Two-thirds of data centers (65%) rate High for average annual loss, and 61% rate High for growth in utility demand, driven mainly by cooling needs. Half face a High retrofit cost impact. Insurance is the exception: three in four sites see Low or Medium premium growth, and only 133 sites (1.5%) risk becoming uninsurable by 2050.
High-risk sites are hit hardest
Our financial impact analysis found that over a 10-year hold, climate impacts can cut the value of a high-risk data center by 14.3%, more than double the 6.7% at other sites. The gap shows up across operations, not only in damage. Cooling, for instance, is a climate-driven cost that affects nearly every site: cooling demand grows 2.3% a year across the portfolio.
But adaptation investments will likely pay dividends. At high-risk sites, building-level measures can recover 9.5 points of the 14.3% loss, about two-thirds of potential losses.
| Metric (SSP3-7.0) | High-risk sites (1,442) | Other sites (7,265) |
|---|---|---|
| VALUE | ||
| 10-year loss in net present value | 14.3% | 6.7% |
| Average annual loss | 1.4% | 0.7% |
| Climate premium on the discount rate | 0.36 pts | 0.17 pts |
| Value recoverable through asset-level adaptation | 9.5% | 4.4% |
| INSURANCE | ||
| Climate-driven insurance premium growth to 2050 | 3.1%/year | 2.1%/year |
| Sites becoming uninsurable by 2050 | 3.9% | 1.1% |
| OPERATIONS | ||
| Extra operational downtime | 1.4 days/year | 0.2 days/year |
| Operational efficiency loss | 3.8%/year | 1.6%/year |
| Workforce productivity loss | 2.4%/year | 0.7%/year |
| COSTS | ||
| Maintenance cost increase | 0.39%/year | 0.34%/year |
| Utility demand growth | 1.3%/year | 1.7%/year |
| Retrofit CapEx (% of annual income) | 1.8% | 2.0% |
Note: like most forecasts, our estimates are directional, not precise. For a methodological overview, see AlphaGeo Financial Impact Analytics.
Low-risk data centers can experience larger cost increases
Risk level and cost growth are not the same thing. Sites in hot markets already run heavy cooling, so further warming adds relatively little to their bottom line compared to sites where heat stress is set to experience significant change from the baseline. This is why cooling demand grows by only about 1–2% a year in the UAE, Saudi Arabia, India and Singapore. In comparison, sites in temperate markets are warming from a lower base, and will face a starker increase in cooling costs. For instance, cooling demand can increase by more than 4% a year for sites in Canada, Australia, France and Mexico.
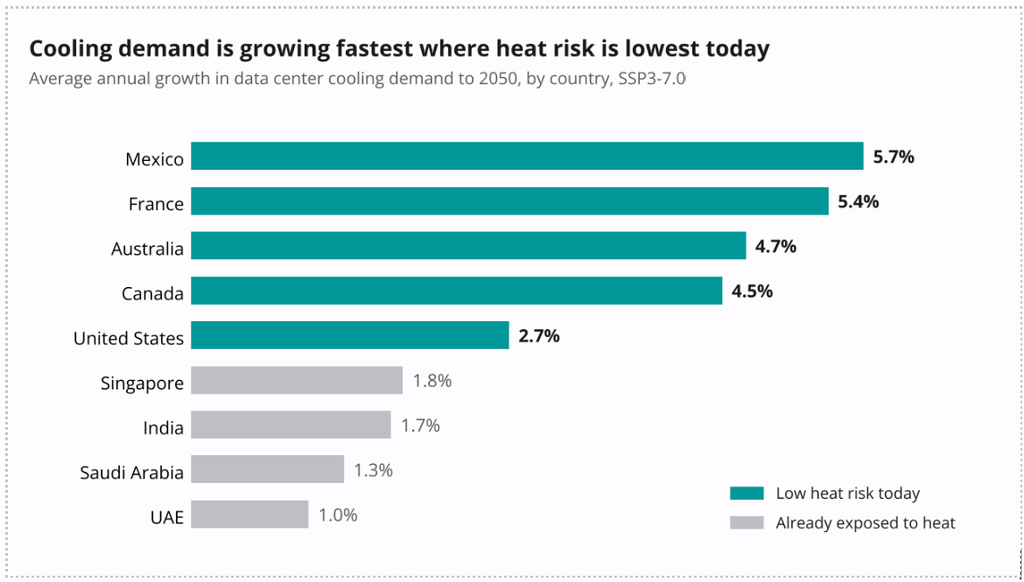
In all, 2,099 data centers that score Low or Very Low on heat today face cooling demand growth above 3.5% a year. A low risk score is not a low cost forecast: operators in temperate markets should budget for rising cooling, energy and retrofit costs even where hazard exposure stays modest.
How do data centers affect climate resilience in surrounding
With data centers drawing on the same power and water as their neighbors, and community opposition intensifying, operators should also plan for their impact on surrounding communities.
Our data shows where the overlap is sharpest:
- Water. 3,547 sites (41%) already sit in basins where demand exceeds 40% of available supply, the High band for water stress.
- Weak grids. Of the 735 sites facing High heat or drought risk by 2050, 642 (87%) are in countries scoring below the median on the World Energy Council’s Energy Trilemma Index.
What operators can do
- Invest in shared defenses. Local infrastructure such as drainage and flood barriers lowers risk for the site and its neighbors. Local adaptation already reduces risk substantially: on physical hazard alone, 3,822 sites (44%) would be High risk today, but once existing defenses and community resilience are counted, that falls to 864 (10%), a 77% reduction.
- Plan peak load with the utility. Model heatwave-day cooling demand, not annual averages, and fund on-site storage or flexible load so peaks do not land on households.
- Cut water draw in stressed basins. Use closed-loop or non-potable cooling, and report water use by site.
- Site with the community in mind. Screen new locations on resilience-adjusted risk and local grid and water capacity together, prior to any commitment.
How should climate risk inform data center site selection?
Site selection is the stage where physical climate risk can still be managed at lowest cost. The financial and operational impacts of climate risk demonstrate why initial screening should include climate exposure alongside the factors that conventionally determine data center viability: power cost and reliability, network connectivity, water availability, land cost and incentives. A complete assessment should also consider qualitative factors, including regulatory and community receptivity to new facilities, and quantify a project’s expected effect on local power and water systems.
AlphaGeo’s Data Center Suitability tool is an example of how geospatial data science can help provide efficient, low-cost screens across key dimensions. This free tool offers a county-level screen of the United States across five dimensions: power and grid, connectivity, water availability, site economics and climate resilience.
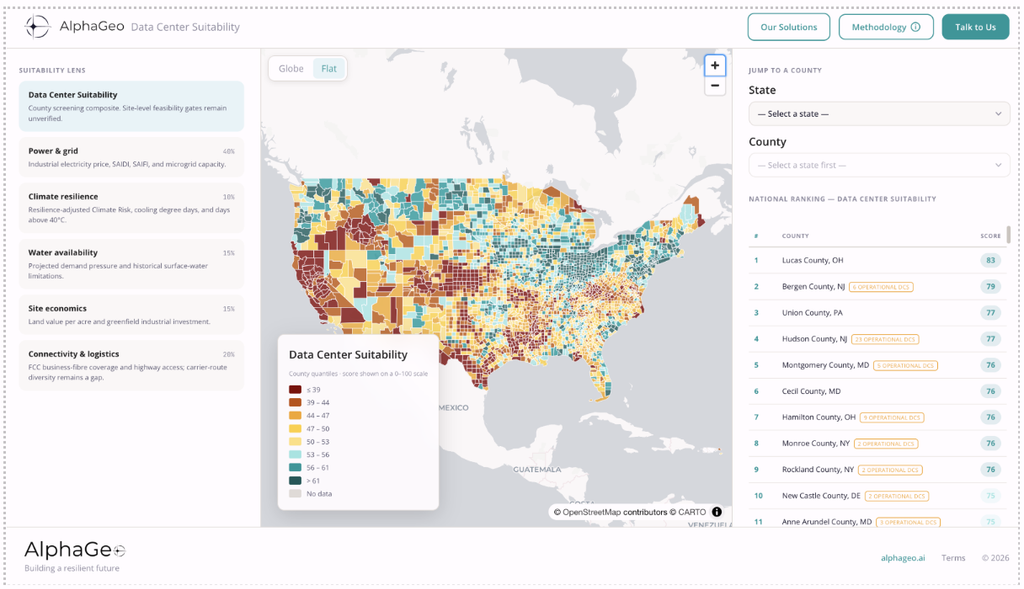
Interested readers can contact AlphaGeo to develop bespoke suitability assessments and more granular, interactive maps tailored to an operator’s criteria and target markets. For further information, contact info@alphageo.ai.
Sources
- Data Center Map, Data Centers (data center locations and status)
- AlphaGeo, Data Center Suitability (county-level site screening, United States)
To score your own portfolio, visit alphageo.ai or start a free trial. You can also explore our free Data Center Suitability tool.