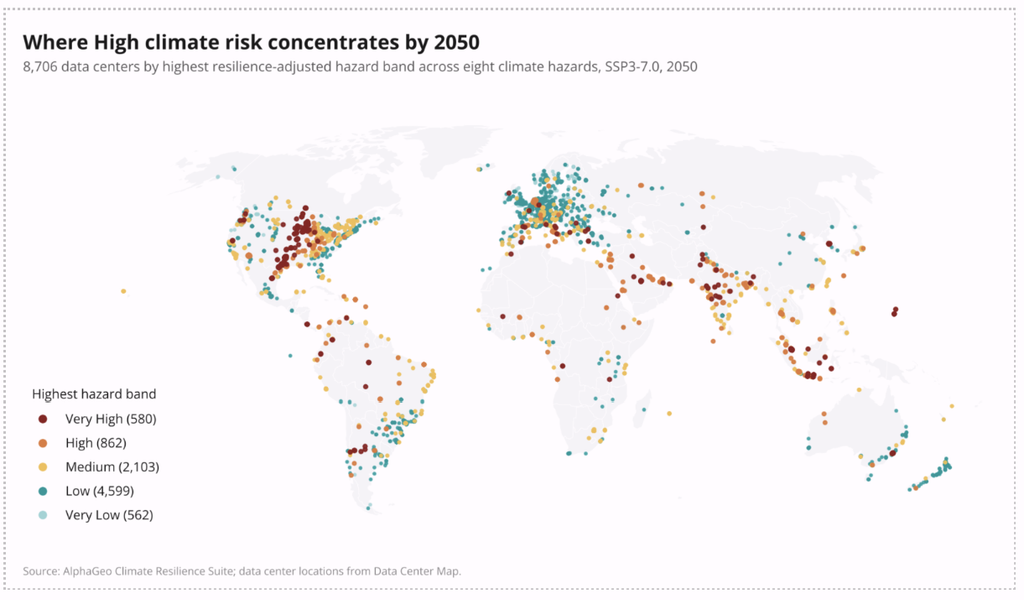
To assess physical climate risk for U.S. assets, resolve each location’s exposure to the specific hazards it faces – flood, heat, wildfire, hurricane, drought, and others – using forward-looking climate data, then weight that exposure against the asset’s vulnerability and the adaptation already in place, and translate the result into financial impact.
The assessment process follows clear steps:
- Identify the material physical hazards for each location.
- Pull data from credible sources (such as FEMA, NOAA, and specialized data providers).
- Score hazard and vulnerability at the asset level across future climate scenarios and time horizons.
- Quantify what that exposure means for asset value and operational performance.
Done right, physical climate risk assessment much more than whether an asset sits in a risky area. It answers critical questions: How exposed is this specific asset? How badly could it be hit? What will that damage cost?
In short, physical climate risk is local and forward-looking, so a credible assessment must therefore be asset-level, scenario-based, and resilience-adjusted.
Below is a detailed guide on how to perform an assessment, the key U.S. data sources to leverage, and the common pitfalls to avoid.
What Are Physical Climate Risks Businesses Face in the US?
Physical climate risks are the direct threats that climate hazards pose to physical assets and operations. They fall into two categories:
- Acute risks – discrete, event-driven hazards: inland and coastal flooding, hurricanes, wildfires, hailstorms, and severe storms. These cause sudden, often catastrophic damage.
- Chronic risks – gradual, long-term shifts: rising heat, prolonged drought, water stress, and sea-level rise. These erode asset performance, raise operating costs, and degrade viability over time.
In the U.S., the hazard mix varies enormously by location. A Gulf Coast property is dominated by hurricane and storm-surge risk; a Western asset by wildfire, drought, and heat; a Midwestern facility by inland flooding, hail, and severe storms. Almost every U.S. asset faces a combination of perils and it is these combinations – rather than single hazards – that often drive real-world risk.
The reason physical risk from climate change has become a board-level concern is that it now flows straight into financials: property damage, business interruption, soaring insurance costs, and impaired asset value.
Assessing these risks precisely is the first step to managing it – which is exactly what AlphaGeo’s Climate Risk & Resilience Index is built to do, scoring nine distinct hazards at the asset level.
What Are the Most Important Physical Climate Risks to Prioritise?
There’s no universal priority list – the most important physical climate risks are the ones material to your specific assets and locations. Materiality, not severity in the abstract, is what should drive prioritization.
That said, a practical approach is to prioritize hazards along three dimensions:
- Probability and severity at the location. How likely is the hazard here, and how damaging if it occurs? A high-probability, high-severity hazard at a key asset is the top priority.
- Asset vulnerability. How exposed is this particular asset given its construction, elevation, and critical systems? A moderate hazard against a highly vulnerable asset can outrank a severe hazard against a hardened one.
- Financial consequence. What’s at stake – asset value, revenue, business continuity? Prioritize where the financial impact of failure is greatest.
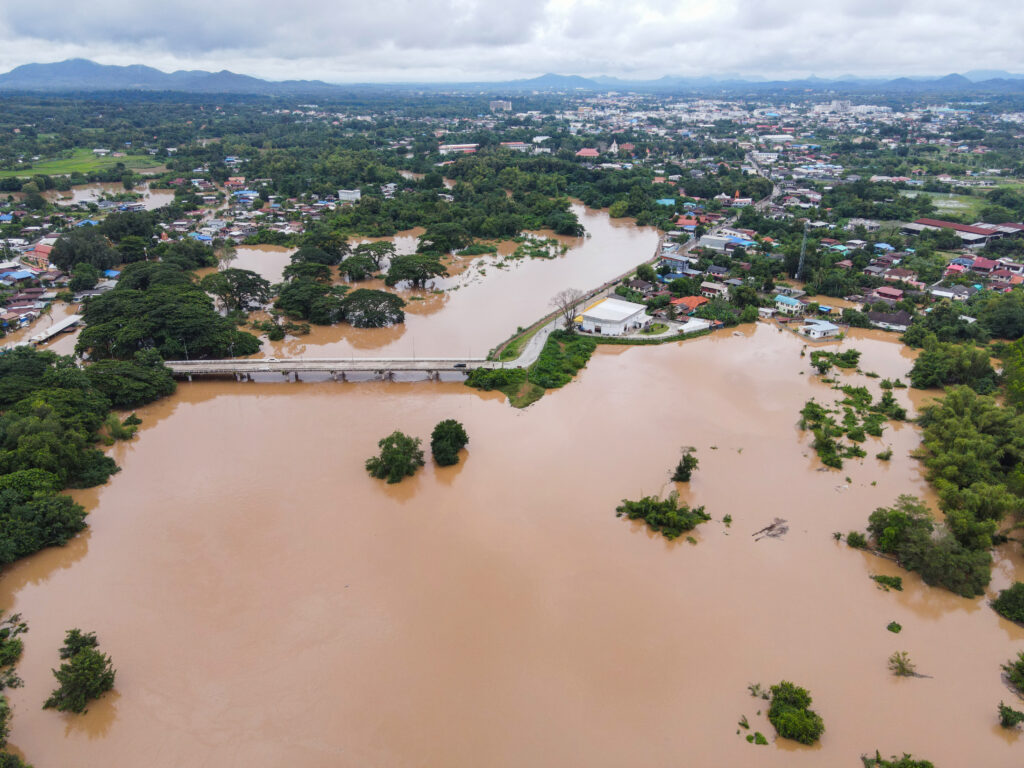
For most U.S. portfolios, flooding ranks first – it’s the most widespread and frequently underestimated peril (more on the FEMA data gap below). Extreme heat is a rising priority because it’s pervasive, chronic, and drives both cooling costs and infrastructure stress. Wildfire dominates in the West and increasingly drives insurance non-renewal. Hurricanes and storm surge lead along the coasts. The right move is to score all material hazards and let the combination of probability, vulnerability, and consequence set your order – rather than reacting to whichever hazard made the latest headlines.
How Do You Assess Physical Climate Risk for Assets or Locations?
Assessing physical climate risk for a specific asset or location follows five steps:
- Pinpoint the location. Use exact coordinates, not a city or ZIP. Physical risk varies block by block – elevation, drainage, and surroundings make two nearby assets very different.
- Identify material hazards. Determine which of the physical perils are relevant to that location.
- Model hazard exposure over time. Score the probability and severity of each material hazard across multiple emissions scenarios and time horizons – because an asset’s risk in 2050 may differ sharply from today.
- Assess vulnerability and adaptation. Evaluate how sensitive the asset is and what protection already exists – local flood defenses, drainage, building standards, broader resilience. This converts raw hazard into real-world, resilience-adjusted risk.
- Quantify the impact. Translate the resilience-adjusted risk into financial terms – expected annual loss, insurance and operating-cost effects, CapEx needs, and valuation impact.
The two steps most often skipped are forward-looking modeling (step 3) and adaptation adjustment (step 4). Omitting these steps makes an assessment misleading, as a score based on historical data and raw hazard alone over- or under-states real risk. AlphaGeo’s Index addresses both directly, modeling across SSP scenarios and horizons to 2100 and applying a triple-layer adaptation offset to produce a resilience-adjusted score. This is the core of any credible physical climate risk assessment.
Key Data Sources for US Climate Risk Assessment (FEMA, NOAA, etc.)
A physical climate risk assessment is only as good as its data. Here are some key U.S. sources, and how to use them effectively:
- FEMA Flood Maps – the official flood-zone designations. Useful as a baseline, but built for insurance-rate setting: often outdated, generally excluding rainfall-driven flooding and future climate conditions. Treat as a floor, not the full picture.
- FEMA National Risk Index – a community-level (county and census-tract) relative-risk measure across 18 natural hazards, combining hazard data with social vulnerability and built-environment factors. Strong for regional screening, but not asset-level.
- NOAA / NCEI – the National Oceanic and Atmospheric Administration provides foundational climate and weather data. Note that NOAA’s widely cited Billion-Dollar Weather and Climate Disasters database was retired by the government in 2025 (archived through 2024) and subsequently relaunched independently using the same methodology.
- Specialized climate intelligence platforms – providers like AlphaGeo that fuse these and proprietary datasets into asset-level, resilience-adjusted scores.
The practical takeaway: public sources (FEMA, NOAA) are essential foundations but were largely built for purposes other than forward-looking, asset-level investment risk. A rigorous assessment combines them with forward-looking, parcel-level modeling – which is what specialized platforms add.
How Physical Climate Risk Differs by US Region (Coastal vs Inland)
Physical climate risk is geographically distinct, and understanding regional patterns sharpens any assessment.
Coastal regions (Gulf, Southeast, parts of the West and Northeast coasts) are dominated by:
- Hurricanes and tropical storms
- Storm surge and coastal flooding
- Sea-level rise (a chronic, compounding threat)
- The associated insurance crisis – coastal markets are where carriers have retreated most aggressively and premiums have risen most steeply.
Inland regions face a different mix:
- Inland (riverine and rainfall-driven) flooding – often underestimated because it’s outside coastal attention and frequently outside FEMA high-risk zones.
- Extreme heat and drought, especially across the South and Southwest.
- Wildfire across the West and increasingly the wildland-urban interface.
- Severe convective storms, hail, and tornadoes across the Midwest and Plains.
A key insight: inland doesn’t mean safe. Rainfall-driven flooding, heat, and wildfire affect vast inland areas, and because these risks get less attention than coastal hazards, they’re more often mispriced. This regional variation is exactly why assessment must be location-specific – a national or even state-level view washes out the differences that determine an individual asset’s risk. AlphaGeo’s nine-hazard scoring, at resolution down to 5–10 meters, is designed to capture precisely these local distinctions.
How Climate Change Physical Risk Impacts Asset Value and Financial Performance
Physical climate risk isn’t an abstract environmental concern – it directly affects directly into asset value and financial performance through several channels:
- Direct damage and repair costs. Acute events damage or destroy assets, requiring CapEx and causing write-downs.
- Rising insurance costs. Premiums have climbed sharply in exposed U.S. markets, and some assets are becoming hard to insure at all – compressing net operating income and, in extreme cases, threatening liquidity.
- Business interruption. Downtime from a flood, fire, or storm can cost more than the physical damage, especially for operations with tight continuity requirements.
- Higher operating costs. Chronic risks like heat raise energy and maintenance costs over an asset’s life.
- Financing and valuation effects. Lenders increasingly price climate risk into terms, and buyers discount exposed assets – one widely cited analysis projected climate-driven insurance costs and demand shifts could erase roughly $1.47 trillion in U.S. property value.
The cumulative effect is that an asset’s climate exposure now materially shapes its income, its cost of capital, and its resale value. This is precisely why IFRS S2 and TCFD-aligned reporting require connecting physical risk to the financial statements – and why quantifying the financial impact (not just the hazard) is the most important output of an assessment. AlphaGeo’s Financial Impact Analytics translate resilience-adjusted risk into exactly these value and performance terms.
Tools and Models Used for Physical Climate Risk Assessment
The tools available for physical climate risk assessment span a spectrum:
- Public maps and indices (FEMA, NOAA, National Risk Index) – free and authoritative, but generally regional, backward-looking, or built for non-investment purposes. Good for screening, insufficient for asset-level decisions.
- GIS and mapping tools – flexible for overlaying data, but they describe rather than assess; interpretation and forward modeling are left to you.
- Specialized physical-risk platforms – purpose-built climate intelligence tools that combine climate models, geospatial data, and adaptation information into forward-looking, asset-level, resilience-adjusted scores with financial translation.
Underneath these, the models that matter are: climate models (projecting hazard under different emissions scenarios), hazard models (translating climate variables into flood depths, fire probability, heat exposure at a location), vulnerability models (estimating damage given an asset’s characteristics), and financial models (converting risk into expected loss and valuation impact).
The defining features of a strong tool are the ones this guide keeps returning to: asset-level resolution, forward-looking multi-scenario projections, resilience adjustment, and financial translation. AlphaGeo’s Climate Risk & Resilience Index combines all four, which is what distinguishes a decision-grade platform from a mapping tool.
You can try it with a free trial.
Common Mistakes Businesses Make in Climate Risk Assessments
Even well-intentioned assessments go wrong in predictable ways. The most common mistakes:
- Relying on regional averages. Scoring at the county or ZIP level washes out the parcel-level variation that determines an individual asset’s true risk.
- Using only historical data. The past is no longer a reliable guide to future climate. Backward-looking assessments systematically misjudge forward risk.
- Treating FEMA zones as complete. FEMA flood maps exclude rainfall-driven flooding and future conditions; “FEMA-clean” assets can still be seriously exposed.
- Ignoring adaptation. Scoring raw hazard without accounting for existing defenses over-states risk for well-protected assets and obscures the value of resilience investment.
- Assessing a single scenario. Picking one climate future ignores the uncertainty; credible assessment spans multiple emissions pathways and horizons.
- Stopping at the hazard score. Failing to translate risk into financial terms leaves the assessment unable to support decisions or satisfy disclosure requirements.
- Treating it as a one-time exercise. Climate risk evolves; an assessment that isn’t refreshed on a cycle goes stale.
The common root of these mistakes is settling for data that’s too coarse, too backward-looking, or too disconnected from financial reality. Sound – and actionable – climate risk assessments insist onasset-level, forward-looking, resilience-adjusted, financially translated analysis.
Conclusion
Assessing physical climate risk for U.S. assets comes down to a disciplined sequence: pinpoint each location, identify its material hazards, model exposure forward across scenarios and decades, weight it against vulnerability and existing adaptation, and quantify the financial impact. The quality of the assessment depends heavily on resolution and method – asset-level not regional, forward-looking not historical, resilience-adjusted not raw-hazard, and financially translated not merely descriptive. Public sources like FEMA and NOAA provide a basic starting point, but often understate and over-generalize the risk. This is why most businesses turn to commercial providers that offer granular, asset-level analytics.
Businesses that leverage forward-looking, parcel-level analytics produce assessments they can actually act on, defend to stakeholders, and use to protect value before the next event arrives.
To assess physical climate risk at the asset level across nine hazards and multiple scenarios, explore AlphaGeo’s Climate Resilience Suite or book a demo.
Frequently Asked Questions
What are the most important physical climate risks businesses should prioritize?
The most important physical climate risks are the ones material to a business’s specific assets and locations – materiality should drive prioritization, not abstract severity. To prioritize, score each hazard on three dimensions: probability and severity at the location, the asset’s vulnerability to it, and the financial consequence of failure. For most U.S. portfolios, flooding ranks highest (it’s the most widespread and most often underestimated peril), followed by extreme heat (pervasive and chronic), wildfire (dominant in the West), and hurricanes and storm surge (along the coasts). The right approach is to score all material hazards at the asset level and let the combination of probability, vulnerability, and consequence set the order – rather than reacting to the latest headline event.
Which platforms offer the most accurate physical climate risk assessments for commercial real estate in the United States?
The most accurate platforms for U.S. commercial real estate share four traits: parcel-level resolution, forward-looking multi-scenario modeling rather than historical data or static FEMA zones, resilience adjustment that accounts for local adaptation capacity, and financial translation into value and performance terms. Accuracy is determined largely by data resolution and whether adaptation is factored in – hazard-only, regional scores systematically misjudge real risk. AlphaGeo’s Climate Risk & Resilience Index is built for this, scoring nine hazards at address-level granularity across SSP scenarios and horizons to 2100, with a triple-layer adaptation offset and Financial Impact Analytics. When comparing platforms, test each on properties you know well and judge the explanation behind the score, not just the number.
How should physical climate risks be reported under TCFD?
Under TCFD – now carried forward by IFRS S2 – physical climate risks should be reported across the four pillars: governance (who oversees the risk), strategy (how physical risks affect the business across short, medium, and long horizons under multiple scenarios), risk management (how the risks are identified, assessed, and managed), and metrics & targets (quantified exposure). The key requirement under IFRS S2 is connecting physical risk to the financial statements – showing the effect on financial position, performance, and cash flows – rather than describing it qualitatively. This means physical-risk reporting needs asset-level, scenario-based, financially quantified data, not a narrative summary.
How should businesses prioritise physical climate risks across different locations?
Businesses should prioritise across locations by scoring every asset on resilience-adjusted risk and financial consequence, then ranking them into tiers – urgent (high exposure and high financial stake), monitor (moderate), and accept (low). The critical discipline is comparing locations on a consistent, asset-level methodology so the ranking reflects genuine differences rather than data inconsistencies. Because physical risk is intensely local, a portfolio almost always contains wide variation – some assets carrying severe, mispriced exposure that regional data hides. Prioritising by resilience-adjusted risk directs limited adaptation budget to where it reduces the most financial risk per dollar.
How does climate change physical risk impact asset value and financial performance?
Physical climate risk impacts value and performance through several channels: direct damage and repair costs from acute events; rising insurance premiums (and, increasingly, unavailability of coverage) that compress net operating income; business interruption from downtime; higher operating costs from chronic risks like heat; and financing and valuation effects as lenders price in risk and buyers discount exposed assets. Collectively these shape an asset’s income, cost of capital, and resale value – which is why disclosure frameworks now require connecting physical risk to financial statements. Quantifying this financial impact, not just the hazard, is the most decision-relevant output of any assessment.
How do you assess physical climate change risks for real estate or infrastructure assets?
For both real estate and infrastructure, the assessment follows the same core sequence: pinpoint the exact location, identify material hazards, model exposure forward across multiple scenarios and time horizons, weight it against the asset’s vulnerability and existing adaptation, and quantify the financial impact. The main difference is time horizon – infrastructure’s multi-decade service life demands modeling further out (2050 and beyond) and designing for future conditions, while real estate is often assessed over a defined hold period plus an exit view. In both cases, asset-level resolution and resilience adjustment are essential, and the output should translate into the financial terms (operating cost, CapEx, valuation) that underwriting and disclosure require.
AlphaGeo supports both through its Climate Resilience Suite, with methodologies calibrated for real estate and infrastructure asset types.
Quick Links:
Climate Resilience Suite
Global Adaptation Layer
Alpha Finder