This piece was originally published on OECD Cogito.
When France recorded its hottest day in history last week, 41°C in Bordeaux, multiple deaths, half the country under red alert, the story got covered the way climate risk almost always is.
One country, one number. A week later Spain ran the same script: AEMET red alerts coast to coast.
But neither tells you which regions inside those countries are actually carrying the long-term cost. A national heat record says a country had a bad week. It says nothing about which regions will still be paying for it in 2035, or how much.
That gap matters. National adaptation budgets, EU resilience funding and disaster planning that still run largely on country averages risk failing the regions most exposed to accelerating climate hazards. A region with real long-term exposure can go years without funding because its country’s overall score looks moderate.
European heatwave: The South isn’t where it hurts most
Our data was built to pierce through those national averages and expose where the risk actually lives.
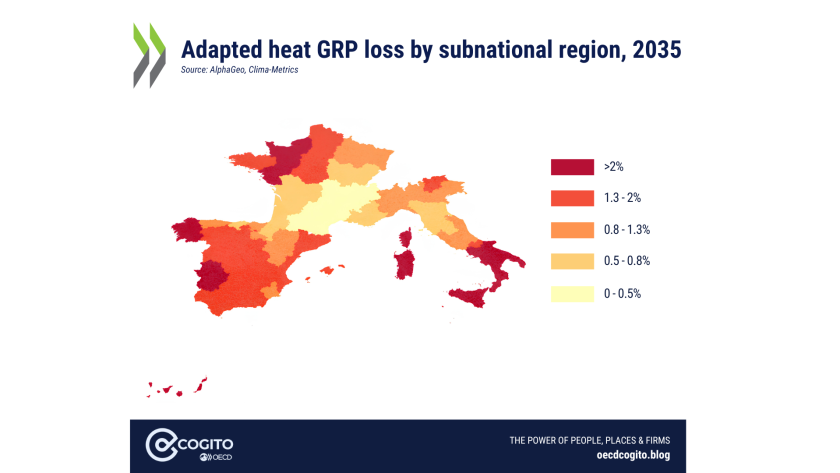
In France, it shows by 2035 the largest subnational GDP losses from heat don’t show up in the Mediterranean south, as people assume but in Normandie (2.30%), Pays de la Loire (2.26%) and Bretagne (1.93%), all ahead of Provence-Alpes-Côte d’Azur (0.76%).
In every one of these regions, manufacturing absorbs roughly half of the heat-driven loss, with services close behind and agriculture contributing only a small share. These regions carry heavy fixed industrial footprints, food processing, automotive and shipbuilding, where heat above critical thresholds inside non-climate-controlled facilities sharply cuts machinery efficiency and labor productivity.
This is an adaptation gap more than a hazard gap. The south has spent decades building for heat: air conditioning penetration, shaded urban design, and agricultural practices suited to sustained high temperatures. The historically temperate west and northwest have almost none of that, so the same rise in temperature costs them more.
Weight each region by its share of national GDP and the picture flips. Île-de-France’s local heat loss is comparatively modest, largely because its agricultural sector is insignificant, yet it contributes 0.45 percentage points to France’s national heat exposure, more than any other region, simply because it’s the biggest economy in the country.
In Spain, Galicia and Extremadura – nowhere near the traditional hot south – show among the country’s highest local heat losses by 2035 (2.79%, 2.69%). Madrid’s local exposure is modest at 1.66%, but it still drives the largest share of national heat GDP risk (0.32pp) on economic weight alone.
Italy, however, follows a more conventional pattern. Its steep north-south heat gradient outweighs adaptation benefits, so the south bears the heaviest losses. Sicilia (4.07%) and Calabria (3.25%) carry more than double the loss of Lombardia (1.00%) or Veneto (0.80%).
The same concentration of heat risk in peripheral island regions appears across the wider Mediterranean. Crete (3.16%), the Canary Islands (3.21%) and Madeira (3.06%) are among the most exposed in their countries, tourism economies with little room to absorb the disruption.
Other European countries, where the risk shifts from sun to sea
Go north and the hazard changes completely, even where the national number looks similar. In the Netherlands it isn’t heat, it’s sea level rise.
By 2035, Flevoland (37.8%), Noord-Holland (33.5%), Zuid-Holland (32.7%) and Zeeland (28.2%), the provinces holding Amsterdam and Rotterdam will see the largest GDP losses from coastal flooding, while inland Drenthe and Gelderland sit at zero.
In Switzerland it’s rivers. Thurgau’s adapted riverine loss is 18%, the highest in the country, while Graubünden, deep in the Alps, is close to zero. Switzerland’s flood risk runs along the Rhine in the north and stops at the mountains.
The same blind spot reappears outside of Europe
In the US, climate risk research and policy attention has historically concentrated on coastal hazards, especially in relation to sea-level rise and hurricanes.
However, significant but less visible climate risk runs through interior states with no coastline at all. Tennessee and Arkansas show combined exposure close to Gulf Coast levels, driven by wind and riverine flooding off the Mississippi Ohio Tennessee watershed, a corridor most inland property and agricultural risk models still ignore.
The damage isn’t hitting farmland, despite the popular image. It’s hitting the manufacturing sector. Manufacturing absorbs 78 to 86% of the riverine losses in this corridor, concentrated in the factories and processing plants built along the rivers for water access and barge transport.
Canada’s national climate risk is really a four-province story. Prince Edward Island, New Brunswick and Nova Scotia carry almost all the national exposure through coastal flooding and wind. Everywhere else, from Quebec to the territories, sits under 1.6% combined loss.
Chile’s drought and heat risk sits almost entirely in the Atacama, the same desert that produces most of the world’s lithium. Arica y Parinacota, Tarapacá, Antofagasta and Atacama all post drought losses above 4%, while the wine valleys and Patagonian south sit under 1.3%. The manufacturing sector here absorbs the bulk of both heat and drought losses, landing directly on the mining operations behind global EV battery supply.
Seven economies, several different hazards, none of them are visible in a single national number. That’s what national averages do. They mask the regions that actually carry the risk.
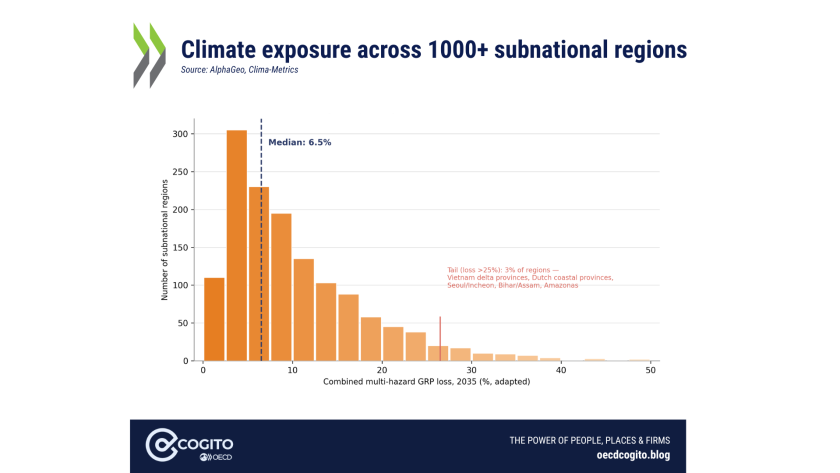
The histogram below shows this isn’t isolated to those seven countries. Across more than a thousand subnational regions worldwide, 3% carry losses above 25%, a quiet tail hiding behind every country’s national average.
For policymakers, that has a direct cost. Governments at all levels need better data and more sharply focused spatial strategies to close that gap.
Without subnational, sector-specific hazard data, the Green Climate Fund, World Bank climate investment criteria, sovereign and municipal climate risk disclosure, national adaptation planning under the UNFCCC, and insurance stress testing will continue to direct resources toward country-level averages rather than the regions facing the greatest exposure.
Closing this gap will make the difference between adaptation spending that arrives in the right place at the right time and adaptation spending that shows up only after the next headline.