Where market attractiveness meets climate resilience
Are today’s REITs invested in markets that will withstand the test of time?
REIT portfolios today are understandably concentrated in high-demand markets, but these locations face mounting climate costs, from surging insurance premiums to necessary adaptation expenditures. To determine where the sector should pivot, we scored approximately 2,000 REIT-owned industrial and commercial properties to compare market dynamism against projected climate resilience.
REITs today are invested in high-potential, but high-risk markets
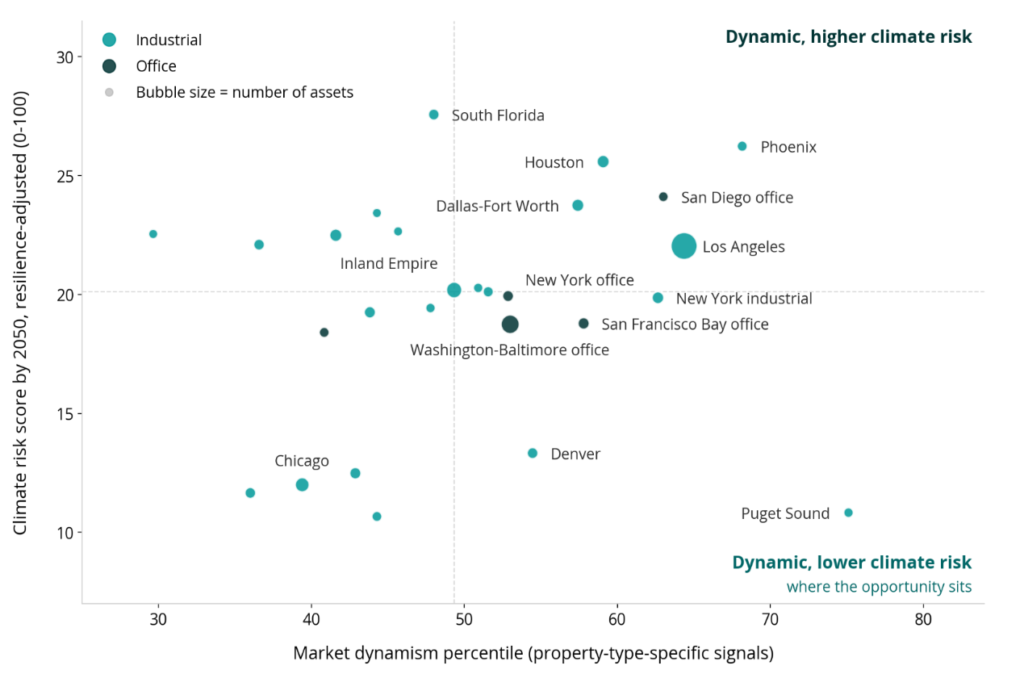
Using our proprietary analytics, we evaluated approximately 2,000 properties held by 15 publicly listed REITs. We measured these assets against two key metrics:
- Market Dynamism: Our composite score of market attractiveness and potential, quantifying the conditions that support future occupancy and rent. For industrial assets, we measure factors like greenfield investment, transit access, workforce depth, and grid reliability. For commercial assets, we look at occupancy, rent growth, job creation, and population change.
- Climate Resilience: The projected climate risk for these locations by the year 2050 under a medium emissions scenario (SSP3-7.0). Climate risk scores are the mean of the 6 climate hazards (heat stress, drought, hurricane wind, inland flooding, coastal flooding and wildfire), resilience-adjusted for local adaptation.
Our analysis reveals a clear picture of current positioning: the industry is heavily invested in economically strong, yet physically vulnerable, locations. Of the assets in markets large enough to score, 70% sit in markets with above-median dynamism. However, two-thirds of the assets located in these highly attractive markets also sit in the higher-risk half for climate exposure.
Source: AlphaGeo Market Dynamism Signals and Climate Risk & Resilience Index, SSP3-7.0.
Climate risks translate into material financial vulnerability
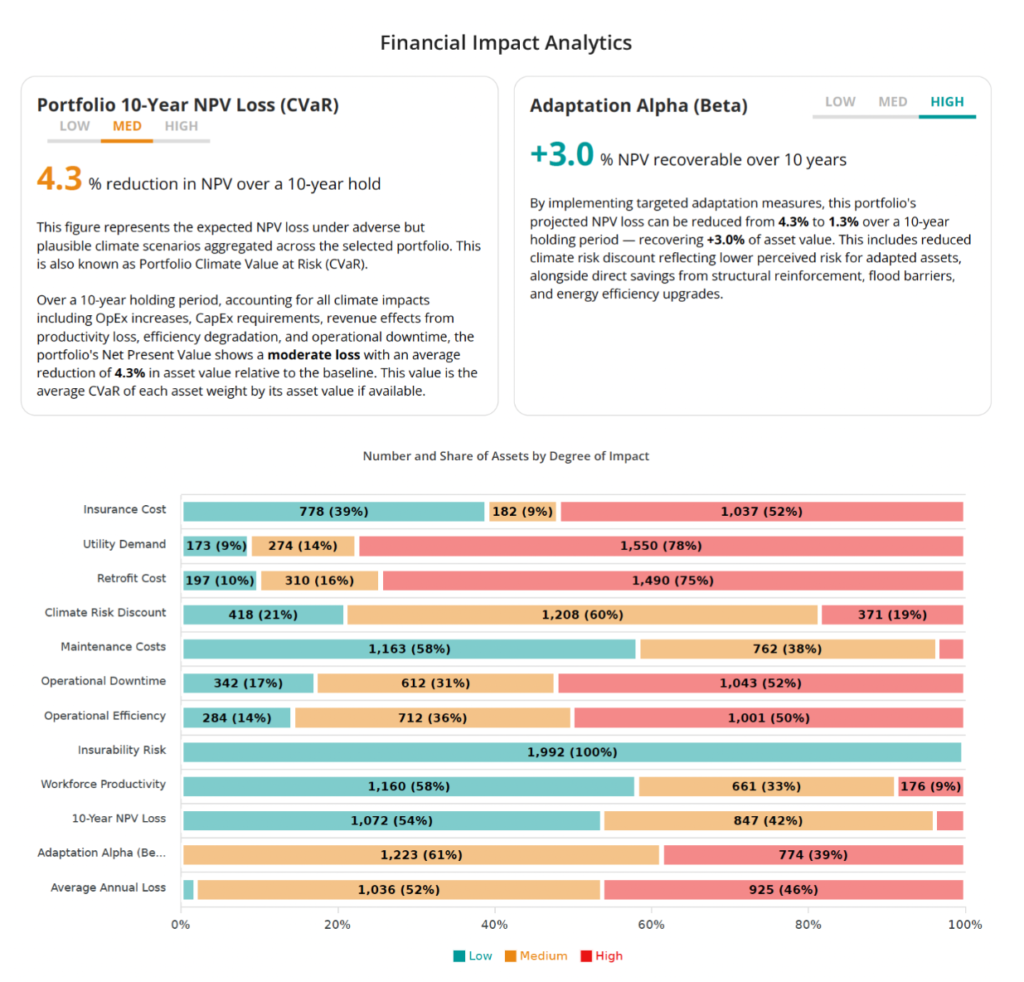
This vulnerability careers a potentially steep financial toll. Across the analyzed portfolio, climate impacts are projected to reduce Net Present Value (NPV) by 4.3% over a 10-year holding period.
Source: AlphaGeo Financial Impact Analytics, SSP3-7.0.
Over 50% of the portfolio falls in the high-impact band for insurance cost, and more than 75% for utility demand. Cost also tracks risk closely. Climate-driven increases in insurance premiums for the riskiest 20% of assets are rising at 9% a year. For the safest 20%, they are still increasing at 1.1% annually.
Fortunately, proactive capital expenditures can mitigate this financial drain. By implementing targeted structural reinforcements, flood barriers, and energy efficiency upgrades, asset owners can recover 3 percentage points of value, effectively cutting the projected NPV loss to just 1.3%.
So where should REITs look to next?
While retrofits improve the viability of individual assets, choosing the right market ultimately determines how heavily those retrofits must work.
To identify tomorrow’s winning markets, we screened for locations that successfully combine above-median economic dynamism with below-median projected climate risk. Within the industrial sector, Denver, Puget Sound, and the New York metro area emerge as the standout lower-risk targets. Denver is particularly compelling, pairing strong dynamism with the second-lowest climate risk in the dataset and almost no premium escalation.
Conversely, while major industrial hubs like Los Angeles, Phoenix, and Houston offer high dynamism, they carry significantly higher climate risks. For commercial office spaces, the Washington-Baltimore and San Francisco Bay areas represent the most promising dynamic, lower-risk opportunities. Washington-Baltimore stands out as the strongest risk-adjusted office position in our set, holding above-median dynamism and below-median risk alongside manageable premium growth of around 3% a year
| Segment | Dynamic and lower risk | Dynamic but higher risk | What to watch |
|---|---|---|---|
| Industrial | Denver, Puget Sound, New York metro | Los Angeles, Phoenix, Houston, Dallas-Fort Worth, Inland Empire | Denver pairs above-median dynamism with the 2nd-lowest climate risk in the set, and almost no premium escalation. Puget Sound and New York metro score well on risk but already carry premium growth above 8% a year |
| Office | Washington-Baltimore, San Francisco Bay | San Diego | Washington-Baltimore holds above-median dynamism at below-median risk, with premium growth near 3% a year. It is the strongest risk-adjusted office position in the set |
Source: AlphaGeo Market Dynamism Signals, Climate Risk & Resilience Index and Financial Impact Analytics, SSP3-7.0.
A critical qualification remains for any investor acting on this data: physical climate risk and insurance repricing are related, but they are not entirely interchangeable. A statistically low-risk market can still carry steep premium growth, as we observe in both New York and Puget Sound, where premium growth exceeds 8% annually despite favorable physical risk scores.
Ultimately, the next generation of real estate investment must move beyond simple demand metrics, rigorously underwriting the localized cost curves of climate adaptation to secure resilient, long-term returns.
Methodological note
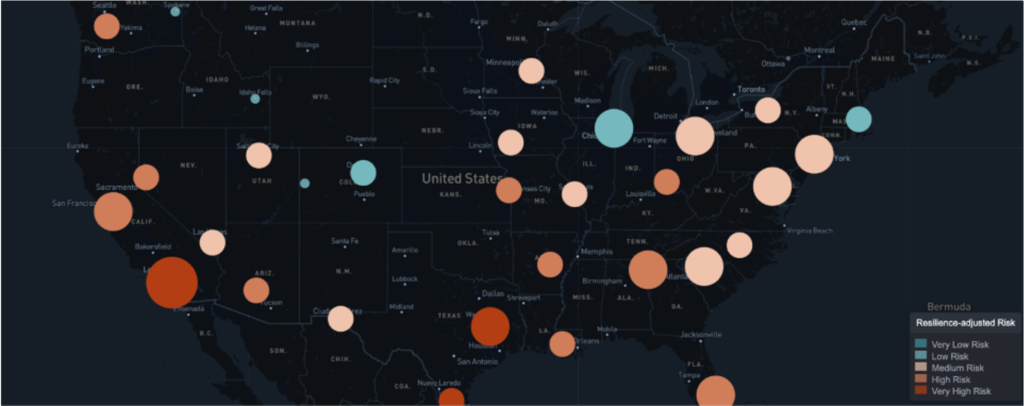
The dataset comprises 1,997 properties held by 15 publicly listed REITs, of which 1,993 are in the United States across 42 states and 4 are overseas records-storage facilities. AlphaGeo classifies each asset as industrial (1,545) or commercial (452); the commercial group is predominantly office, alongside life science and grocery-anchored retail. Property registers were compiled from each REIT’s most recent Form 10-K filing, geocoded, and scored on AlphaGeo’s Climate Risk & Resilience Index, Financial Impact Analytics and Market Dynamism Signals, Nov 2025 data version.
Figures cited use the medium emission scenario, SSP3-7.0. Climate risk scores are the mean of the 6 climate hazards (heat stress, drought, hurricane wind, inland flooding, coastal flooding and wildfire), resilience-adjusted for local adaptation. Earthquake, landslide and hail are scored separately and excluded here because they are near-static over the projection window.
Source: AlphaGeo platform, SSP3-7.0.
Appendix: Climate risk scorecard
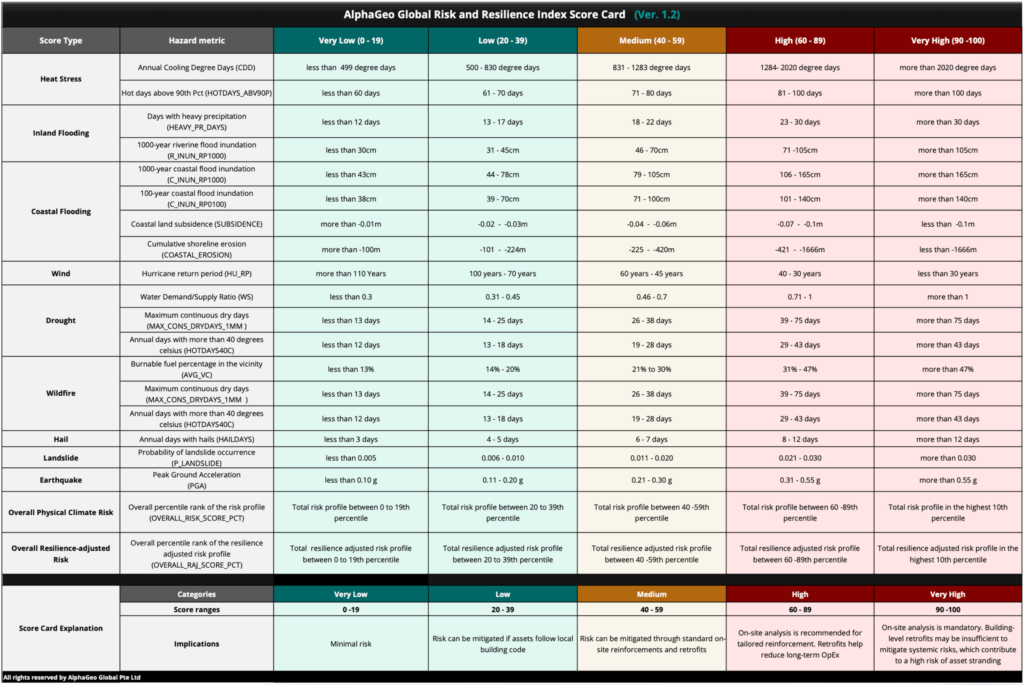
Source: AlphaGeo platform.
This report is provided for informational purposes only and is not for redistribution, resale, or sublicensing. AlphaGeo analytics are intended for internal decision support and may be shared with clients but not commercialized without AlphaGeo’s prior written consent.