As we reach the mid-year mark, we reflect on the performance of the AlphaGeo Industrial Renaissance Tracker (IRT) hypothetical portfolio and examine the market forces — both headwinds and tailwinds — impacting the GeoSense investment strategy and the broader public markets.
If you need a primer on geoeconomics, we recommend Gillian Tett’s recent FT article, “Welcome to the New Age of Geoeconomics” (Financial Times, May 9, 2025).
While much attention remains on the Magnificent Seven (Mag-7) stocks, we continue to observe a compelling and sustainable investment theme emerging beneath the surface — one grounded in geography. A georeferenced investment framework shifts emphasis away from traditional metrics like balance sheets, cash flows, and EBITDA, and instead focuses on location, land, infrastructure, and supply chains.
As outlined in our Q1 update, the IRT framework is based on four core pillars:
- Tracking capital flows and policy signals related to the energy transition
- Identifying high-upside geographies
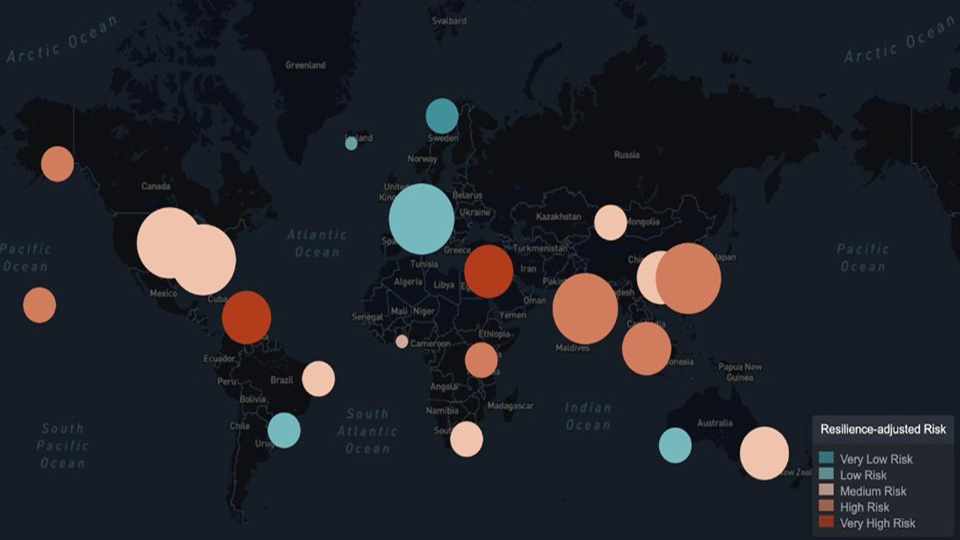
- Stress testing locations for climate resilience
- Mapping companies or assets positioned to benefit from these geographic tailwinds
IRT Performance through June 2025
Despite the dominance of Mag-7 stocks, the IRT thesis continues to deliver value through a diversified, non-correlated portfolio. Arbitrage opportunities remain compelling — especially for long-duration investors with patient capital. As we’ve said before: where you invest is just as important as how.
At the halfway point in 2025, the IRT continues to perform well relative to standard risk-adjusted benchmarks, particularly when viewed through the equal-weighted lens.
5-Year Performance: AlphaGeo IRT vs. IWM Benchmark
Portfolio Growth (Equal Weight):
A $10,000 investment in the IRT on January 1, 2021 would be worth $14,679 as of June 30, 2025 — a cumulative return of 46.79%. By contrast, the benchmark (IWM) would be worth $11,577, reflecting a return of 15.77%.
Return (Equal Weight):
Annualized return for the IRT over this period was 8.90%, with 31 out of 54 months (57.41%) showing positive returns. The benchmark returned 3.31% annually, with 29 out of 54 months (53.70%) in the green.
- Best year for IRT: 2021 (+40.09%)
- Worst year for IRT: 2022 (–12.24%)
Risk (Equal Weight):
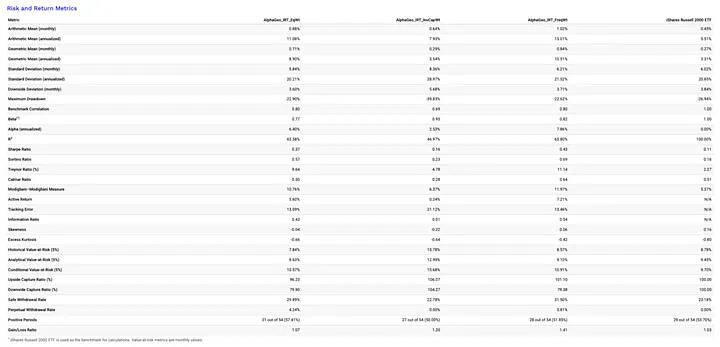
- Max drawdown: –22.90% (Jan–Sep 2022), with a 9-month recovery
- Benchmark drawdown: –26.94% (Jul 2021–Sep 2022), with a 22-month recovery
- Sharpe Ratio: 0.37 for IRT vs. 0.11 for benchmark
- Upside capture: 96.23%
- Downside capture: 79.90%
While the IRT underperforms the S&P 500 over this period, our strategy is designed for long-term value creation. We believe that:
a) The S&P will remain accretive, but with diminishing marginal returns, and
b) The IRT’s long-duration thesis will yield steady, compounding performance, with accelerated gains as capital infrastructure projects mature into commercialization.
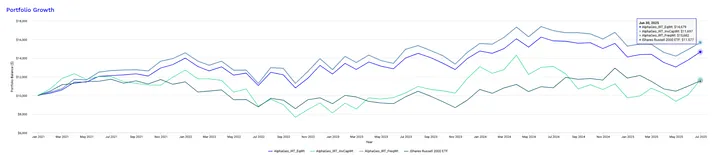
Portfolio Growth (Eq Wt):
$10,000 invested on January 1, 2021 would be worth $14,679 as of June 30, 2025, which represents a cumulative return of 46.79%. Over the same period, the benchmark would be worth $11,577, which represents a cumulative return of 15.77%.
Return (Eq Wt):
Over the same period, the portfolio generated a return of 8.90% per year, with 31 out of 54 or 57.41% of months positive. Over the same period, the benchmark generated a return of 3.31% per year, with 29 out of 54 or 53.70% of months positive. The best year for the portfolio was 2021 with 40.09% return and the worst year over the period was 2022 with -12.24% return.
Risk (Eq Wt):
The maximum drawdown of the portfolio was 22.90% from January 1, 2022 to September 30, 2022 with a recovery time of 9 months. Over the same period maximum drawdown of the benchmark was 26.94% from July 1, 2021 to September 30, 2022 with a recovery time of 22 months. The risk-adjusted return of the portfolio, measured by the Sharpe ratio, was 0.37, whereas the Sharpe ratio of the benchmark was 0.11. The portfolio captured 96.23% of the upside of the benchmark while capturing 79.90% of the downside.
We acknowledge that if we benchmarked against the S&P 500, the IRT would be underperforming; however, we are looking beyond the horizon of most active managers and believe that over a longer investment horizon (a) the S&P will still be accretive to value but at a lower rate of return, and (b) the IRT long duration thesis will generate slower and steady returns while the curve will start to accelerate when some of the associated capital infrastructure projects achieve commercialization status.
The trailing returns summary below underscores this point.

The Risk-Return metrics shown in the table below further strengthen the support for viewing the IRT as a valid and tested portfolio constructing framework, particularly when viewing the equal weight strategy in the first column. Given current market volatility, the annualized alpha capture is strong, max drawdown is manageable, and the hit rate is favorable.
Summary
The IRT portfolio can be viewed as hypothetical ETF or sample portfolio presently consisting of 15 public companies (three portfolios with different weighting schemes), that we compare to the IWM Russell 2000 benchmark. Again, we focus on geographic arbitrage, looking to locations and assets that are poised to grow as the economic trade winds shift.
Referencing a recent interview episode hosted by Financial Sense, Matt Sheehan described the AlphaGeo approach as part of Geospatial 2.0. In Sheehan’s words: “This is not a Geospatial 1.5 risk mapping approach, it is planet-scale predictive intelligence, used to steer investment and insurance decisions decades ahead.” We could not agree more.
Please continue to read and distribute, and do not hesitate to reach out to the AlphaGeo leadership team if you have any questions.