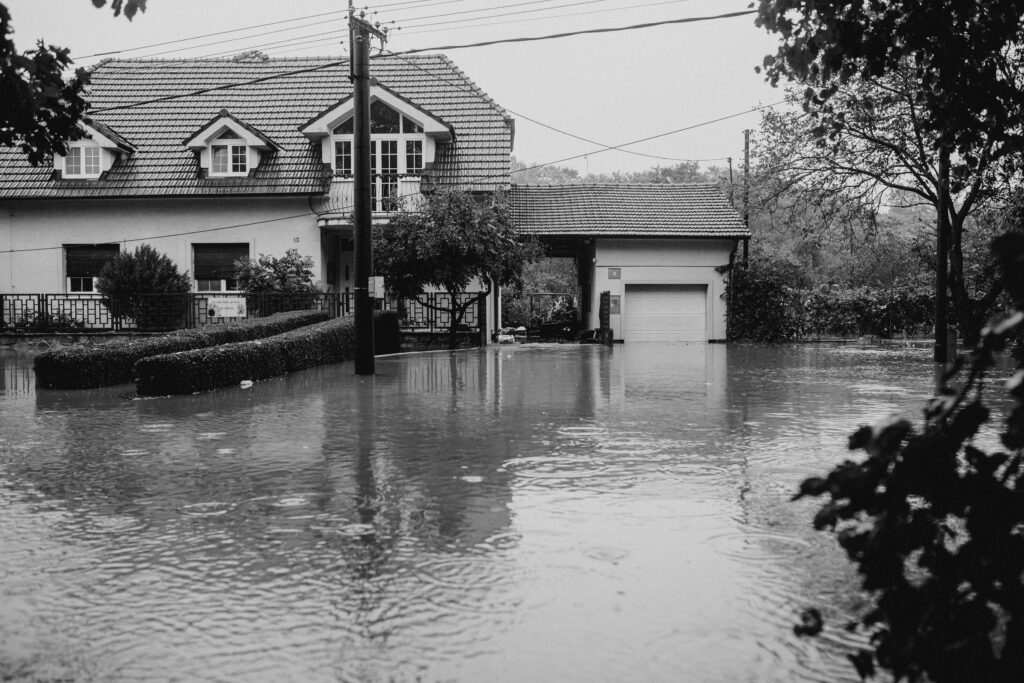
The California wildfires have captured public attention with tragic scenes of destruction. They are, however, only the latest in a series of costly US natural disasters including Hurricane Helene and Milton that caused nearly $100 billion in damage last year.
As climate volatility intensifies, insurers have been ratcheting up premiums in disaster-prone areas or withdrawing coverage altogether. For instance, State Farm dropped over 1,500 policies in Los Angeles’s Pacific Palisades area last year. In response to many locations being deemed “uninsurable,” regulators are beginning to mandate insurance in high-risk areas. In California, a new state regulation under the California Sustainable Insurance Strategy will require private insurers to cover 85 percent of homes in high-risk ZIP codes, with both premiums and payouts likely to rise accordingly. Other states may follow California’s lead.
Beyond Risk to Resilience
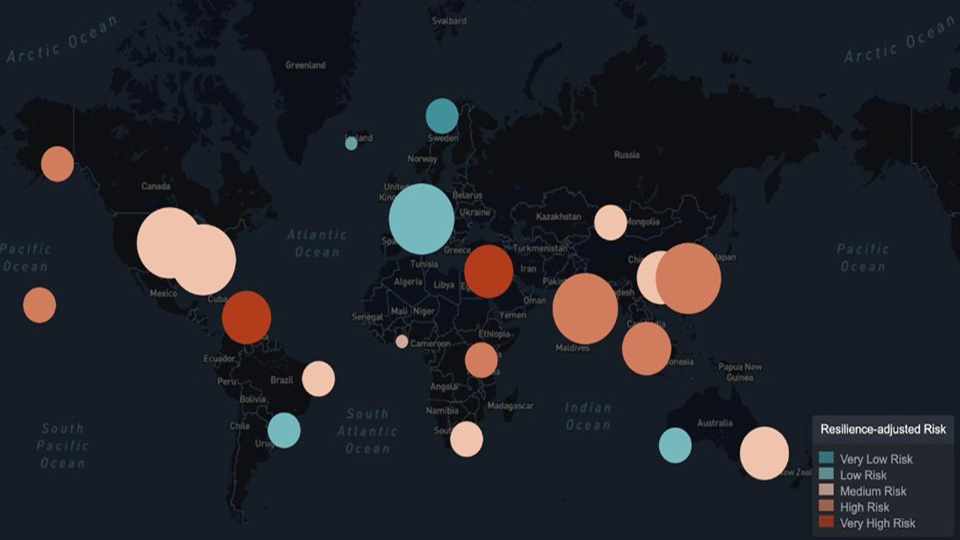
To better gauge where — and how — insurers should remain active, hazard risk data alone is insufficient. AlphaGeo has deployed an equally rigorous approach to measuring adaptation capacity to give analysts a more accurate assessment of a location’s overall resilience. Our formula is straightforward: Risk — Adaptation = Resilience.
By integrating resilience metrics, insurers can differentiate among high-risk locations and tailor premiums accordingly. Insurers could also target higher-resilience locations within disaster-prone regions, balancing risk exposure with profitability.
Here we explore two case studies that demonstrate how AlphaGeo’s resilience data can provide actionable insights for the insurance industry.
Case Study #1: Pacific Palisades, CA — High risk, low resilience
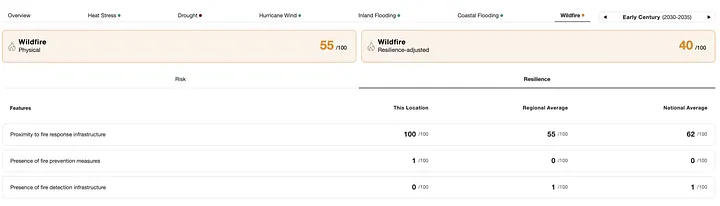
California’s vulnerability to wildfires is well known, but the recent Los Angeles fires caused unprecedented destruction, with estimated losses exceeding $250 billion. Incorporating adaptation metrics provides valuable insight into how the fires spread so rapidly. AlphaGeo’s data highlights not only the presence of burnable timber, dry conditions, and strong winds but also weaknesses in fire detection and prevention measures.
Case Study #2: Asheville, NC — Moderate risk, low resilience
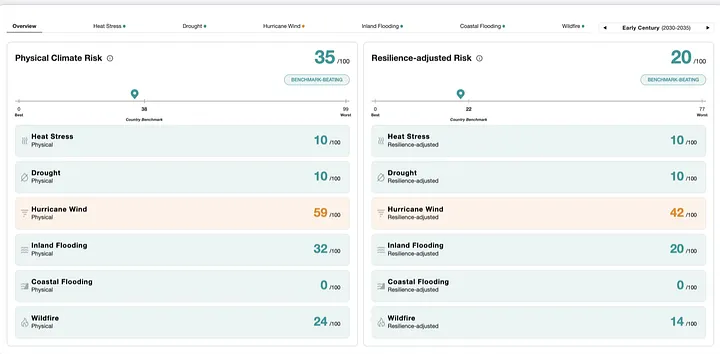
Once considered a “climate haven” due to its perch in the Blue Ridge Mountains, Asheville was devastated by flooding during Hurricane Helene. Here too, AlphaGeo’s deployment of advanced hurricane wind simulations indicates substantial risk — particularly compounded by prior heavy rains — while also quantifying the city’s limited adaptation to a hurricane’s flood impacts. Specifically, these weaknesses include:
- Low building strength rating (29/100)
- Weak flood protection measures (16/100)
The Value of Resilience Analytics for Insurers
AlphaGeo’s global spatial index offers comprehensive adaptation metrics and resilience analytics that deliver the “ground truth” for insurers to better understand how climate hazards will unfold. Our approach provides a technical standard for measuring resilience, and our data is immediately actionable.
We hope to empower insurers to:
- Augment cat-risk models with dynamic and quantitative adaptation data
- Adjust pricing based on resilience-adjusted risk scores
- Guide customers to implement adaptation measures to boost asset resilience
- Continue underwriting policies of customers in high-resilience locations despite risks
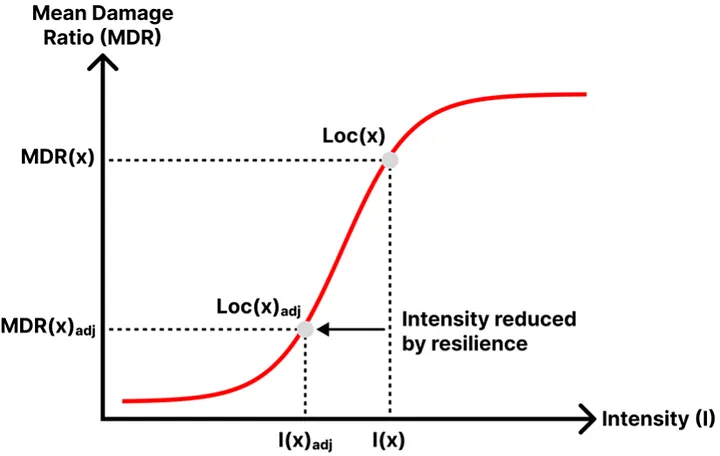
Illustrative use case: Cat-risk modellers can incorporate AlphaGeo’s analytics for resilience-adjusted damage curves
Talk to Sales
To learn more about how AlphaGeo’s resilience analytics can transform your insurance underwriting strategies, please contact us at info@alphageo.ai.
Trial the Product
You can register for a trial account here.