While wildfires, floods, and storms have long dominated the conversation around climate change and real estate, this study by AlphaGeo aims to investigate the impact of the primary climate systems that drive these events in the first place. By focusing on large-scale ocean-atmospheric oscillations such as the Nino 1.2 Index (El Nino) and the Southern Oscillation Index (SOI), the research investigates whether, and to what extent, these global signals influence housing prices in the United States.
At the core of this study is the hypothesis that fluctuations in the ENSO system — measured by the Southern Oscillation Index (SOI) and the Niño 1.2 Index — subtly but measurably affect regional housing market dynamics over time. This was tested through four methodologically rigorous phases, spanning machine learning, causal inference, time-series econometrics, and regional forecasting. The results suggest that climate signals like ENSO may explain around +/- 1.3 percentage points (pp) on average, in annual changes in the Housing Price Index (HPI), with impacts varying across U.S. regions.
Phase 1: Climate Signals and Machine Learning Predictions
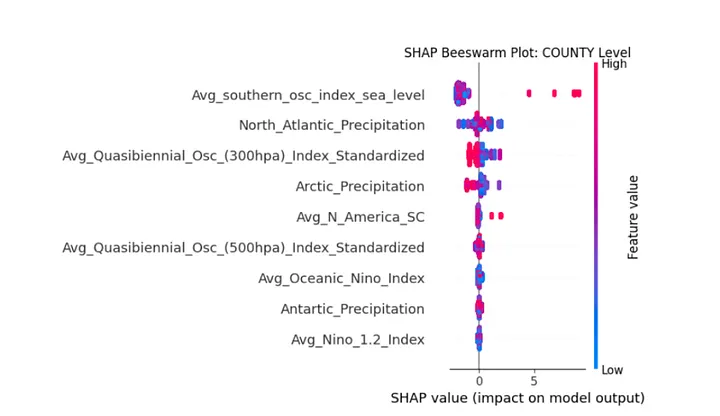
In the foundational phase, a panel dataset of county–level HPI percent changes (2015–2023) was matched with national–level ENSO data quarterly. A tree-based Hist Gradient Boosting Regressor was deployed to test whether these oscillations could explain HPI variance. The model achieved an R² of 0.498, indicating nearly half of HPI changes could be explained by climate oscillations alone. Furthermore, using SHAP analysis (Shapley values), we identified which regions were most sensitive and to what extent individual climate events influenced weather changes (Figure 1). Unsurprisingly, coastal regions like California, Florida, and parts of the Northeast exhibited high sensitivity, while inland areas such as the Midwest were less affected.
Phase 2: Causality, Tipping Points, and Structural Controls
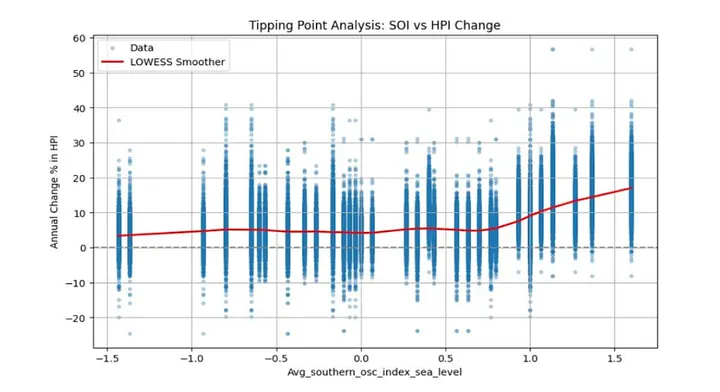
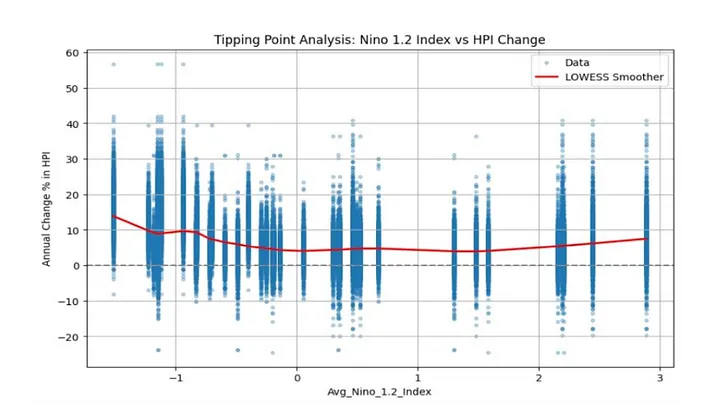
In this phase our focus shifted on establishing whether the observed relationships could be understood causally, and, if so, under what conditions. To move beyond correlation, the second phase explored threshold effects using LOWESS smoothing and piecewise linear regressions. For example, HPI responses accelerated sharply only after SOI crossed +0.75 (Figure 2) or Nino 1.2 dipped below –0.5 (Figure 3) indicating nonlinear tipping points. Next, a Propensity Score Matching (PSM) framework was applied, comparing ‘treated’ counties experiencing climate extremes with matched controls. After adjusting for structural economic indicators like unemployment rate, median household income, and baseline HPI, the causal effect of ENSO shocks largely vanished.
This suggested that while ENSO signals align with housing trends, their standalone explanatory power diminishes when local economic fundamentals are considered.
Phase 3: Time-Lagged Forecasting and Conditional Predictive Power
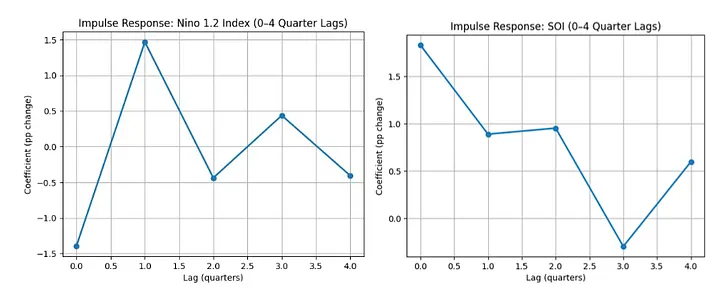
In Phase 3, the focus shifted to temporal dynamics. Using distributed-lag fixed-effects models, state-space models, and Jorda-style local projections, the study mapped out how ENSO signals affect housing prices over multiple quarters. Findings showed that Nino 1.2 (Figure 4) signals depressed HPI in the short term (lag 0) but rebound quickly, whereas SOI (Figure 4) tends to raise HPI in the first quarter post-shock before fading. Yet, these effects were conditional. When applied to all quarters, ENSO added little predictive value. But when restricted to ENSO-active periods (e.g., extreme El Nino events), accuracy improved significantly with RMSE dropping by 0.19pp and R² rising by 5pp.
Phase 4: Regional Forecasting, Quarter-to-Quarter Trends, and Policy Implications
The fourth and final phase tackled a more granular question: How do these oscillations influence HPI shifts across U.S. regions on a quarterly basis? Instead of annual changes, the study examined quarter-over-quarter movements, classifying each as an increase, decrease, or neutral shift and linked these to ENSO values.
The punchline: Regional heterogeneity matters!
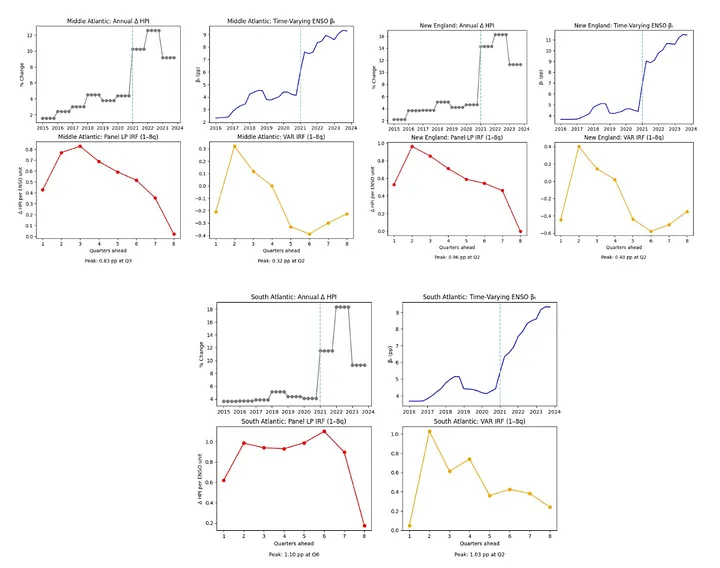
In Middle Atlantic, New England and the South Atlantic (Figure 5), over 65% of ENSO-active quarters coincided with rising HPI values. These patterns suggest that seasonal weather shifts, energy demand, and climate migration may amplify ENSO’s effects in these regions. Conversely, areas like the Pacific and Mountain West showed muted or even negative associations, indicating other local dynamics dominate there. Local projections further suggested that in sensitive regions like New England, price effects from strong El Nino conditions lasted up to 6 quarters (1.5 years), peaking mid-period before tapering off. In contrast, regions like the Pacific showed no statistically significant impact.
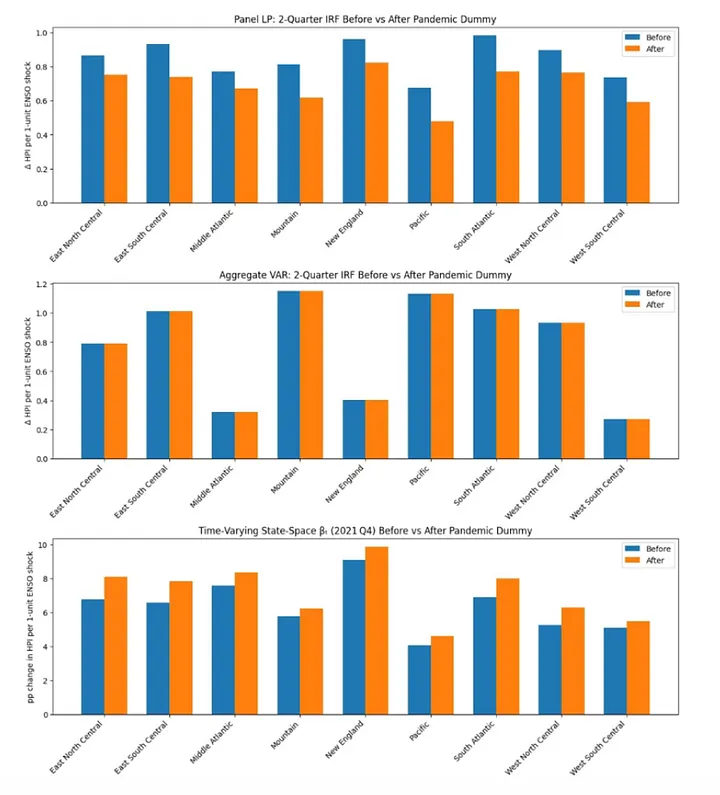
A twist in the data: ENSO’s impact on housing markets appears stronger after 2020. One possible reason? The COVID-19 pandemic, which disrupted mobility, shifted demand, and changed how and where people work — intensifying housing markets’ response to outside shocks. To tease apart this effect, we added a pandemic-period dummy variable (2020–2022). Even so, the core pattern held. Climate signals still influenced housing markets during and after the pandemic, though with slightly reduced intensity (Figure 6).
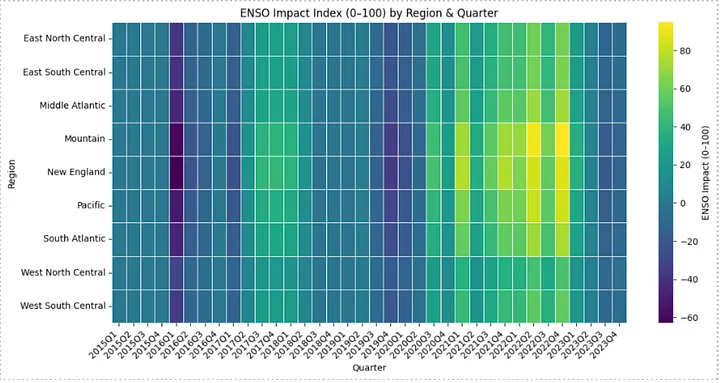
Building the ENSO Impact Index (A Standardized Climate Shock Score): To synthesize findings into a practical tool, AlphaGeo constructed an ENSO Impact Index for each county-quarter. Using regional regression coefficients from pre-2022 data, each county’s quarterly ENSO index was multiplied by its region’s average sensitivity (β coefficient). The result: a percentage-point estimate of climate-driven HPI change, normalized on a 0–100 scale for comparison. This single index confirmed the model’s prior insights (Figure 7). New England and Mountain states lit up with strong effects (scores nearing 100), whereas the Pacific and West North Central regions stayed muted (scores < 30).
To summarize, we found that at the national level, the average signed ENSO impact was 0.71pp, while the mean absolute effect was 1.27pp.
Final Thoughts
This study offers a fresh perspective by showing that housing markets respond to large-scale climate patterns like El Nino and SOI, particularly in regions where these signals are amplified. While not universally impactful, such climate oscillations can meaningfully influence housing trends under specific conditions. As climate patterns become more erratic, the tool developed here can help urban planners, investors, and policymakers better anticipate housing market shifts. Looking ahead, more refined models and detailed data can enhance this work and support the development of climate-resilient real estate strategies.
To support this transition, AlphaGeo has built an index based on the findings by calculating the average climate oscillation driven HPI performance for over 2700 U.S. counties over the 2015–2023 period, ranking them from lowest to highest, and organizing them into seven scoring tiers. This scoring system will serve as a practical tool to assess regional climate sensitivity and guide forward-looking investment and policy decisions. It can be found as a feature component of AlphaGeo’s proprietary Residential Dynamism Signal.
Download Report
Explore our methodology, results, and our proprietary ENSO Impact Index in our full research report, available for download via the link below.
Interested in learning more?
Create a free trial account to explore our Real Estate Dynamism Signals product today.
Alternatively, schedule a demo with us — simply reach out at info@alphageo.ai