Building on a discussion from our most recent GeoSense Market Intelligence report, we are closely monitoring world sugar (#11) crop potential for the current and forthcoming marketing year. The image below shows the most recent move in the spot contract, with price support largely originating from prospects for decreased output from Brazil, the world’s largest producer of the popular sweetener, and important strategic commodity activity spanning both agricultural and energy interests.
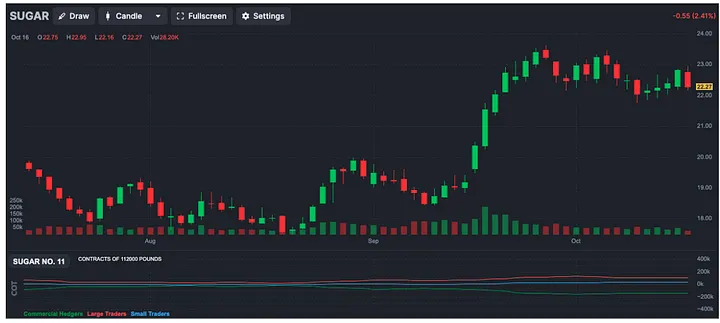
As we noted in the September update, world sugar prices typically move through long periods of rangebound activity, until a trigger event related to physical supply serves as a catalyst for a sharp move — usually to the upside when crop expectations are short. This is when we would expect to see larger swings to net long positions on behalf of traders and risk managers. But once this volatility leads to a shift in trading ranges, the impacts are priced in, so the key is trying to anticipate these swings before they are reflected in spot and derivative prices.
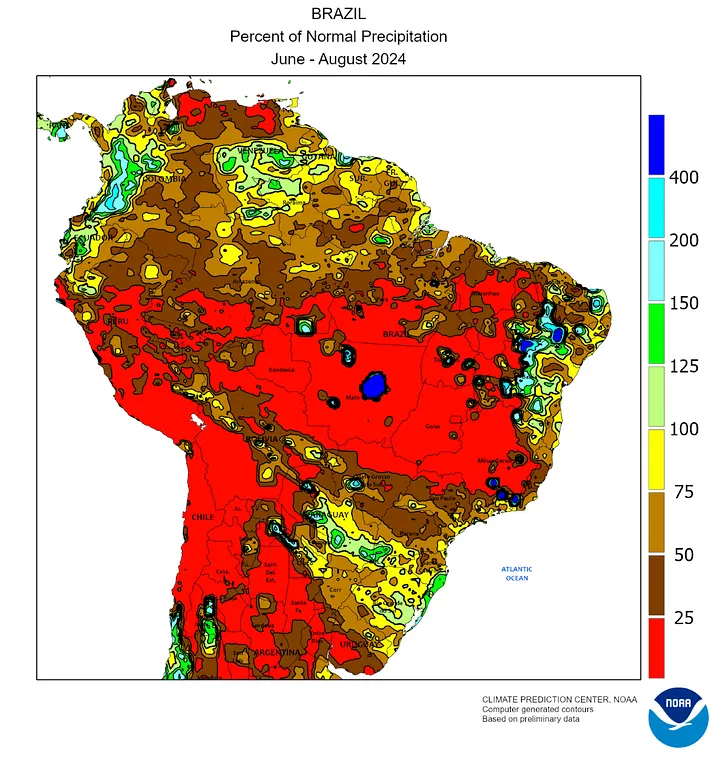
Brazil’s sugarcane land under cultivation is split across two primary agroclimatic regions. The smaller Norte-Nordeste region, and the larger Centre-South growing belt (nearly 2/3 of Brazil’s production), which is centered around production from São Paulo state. While price sensitive demand has been a contributor to weaker short-term prices across the agriculture and soft commodities spectrum over the last year, this has been countered by bullish factors stemming from drought conditions over the last few months, primarily in the Centre-South region. The map below depicts the three-month precipitation anomaly across South America, and the result has been for lower anticipated crop production and yield numbers for the current May/April crop year.
In August, Conab, the primary crop forecasting agency in Brazil, revised their 2024–25 Centre-South sugar production expectations to 42mmt, which is down from their previous estimate of 42.7mmt. If this estimate verifies, it will represent a 5.5% decrease from the previous year’s output. The last Brazil sugar production estimate from the USDA Foreign Agricultural Service was issued in April 2024, which at the time was calling for strong output numbers; we expect to see a downward revision reflected in their next update.
Other Risk Factors
Outside of the agriculture complex, we advise analysts, traders and risk managers to keep an eye on oil prices and FX for directional signal indicators. As uncertainty regarding oil has been moving markets, figuring into the mix of broader macroeconomic variables driving public equity markets, a sustained constructive channel for oil could also provide additional short-term support for sugar. If oil prices remain high, the mixture of fuel that incorporates a blend with ethanol derived from sugarcane may see stronger demand, particularly in Brazil which boasts the world’s largest fleet of ‘Flex-Fuel’ automobiles. In addition, as world sugar is marked on the Intercontinental Exchange in US dollars per pound, the relationship between the USD and Brazilian Real becomes another variable to monitor for forward price volatility.
As the AlphaGeo GeoSense tracking index deploys a multifactorial approach, we will continue to track market activity in sugar and other agricultural and energy commodities, and reference potential market signals to their geographic origins.