This article is the third in a series identifying America’s most dynamic real estate markets. For our analysis of the residential and industrial real estate markets, please see here. Explore a free trial of our platform here: app.alphageo.ai/trial_setup.
Summary
AlphaGeo’s Commercial Dynamism Signal identifies US commercial real estate markets with strong economic vitality, location value, market performance, and growth potential. Built from around 15 datasets consolidated into a composite score, the analysis highlights markets suited for commercial development and further refines the results for retail real estate by screening for foot traffic, walkability, population density, projected population growth, residential construction, and long-term climate risk.
Introduction
In today’s data-rich environment, real estate decision-making relies on far more than intuition. The abundance of information makes it possible to quantify market potential with new levels of precision. But it also introduces a new challenge: separating signal from noise. This article distills insight using a curated set of data-driven, research-backed market signals to identify America’s most promising commercial real estate markets.
Introducing the Commercial Dynamism Signal
To that end, AlphaGeo has developed the Commercial Dynamism Signal — a composite indicator designed to identify locations best-suited to the development of commercial properties, from retail and hospitality to offices and innovation centres.
The Commercial Dynamism Signal toolkit is comprised of an Overall Commercial Dynamism Score, which is built on a curated set of around 15 datasets, consolidated into four key sub-indicators:
1. Economic Vitality: A growing population with disposable income forms the customer base for retail, while a dynamic business environment fuels demand for office space.
2. Location Value: Quantifies the intrinsic, place-based attributes that make an area a valuable hub for commerce, such as population density, foot traffic, and walkability.
3. Market Performance: Assesses the financial health and transactional velocity of the local commercial real estate market through rental/NOI growth, occupancy rates, and transaction volumes.
4. Growth Potential: Assesses the pipeline of future demand, using residential construction as a proxy for future retail customers and leveraging our proprietary long-term population and climate risk forecasts.
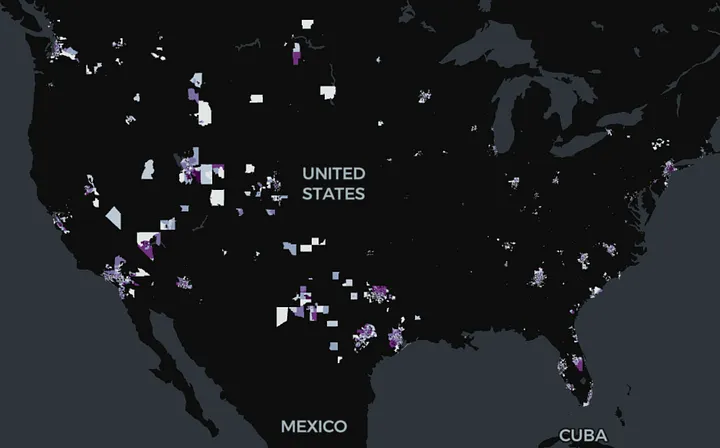
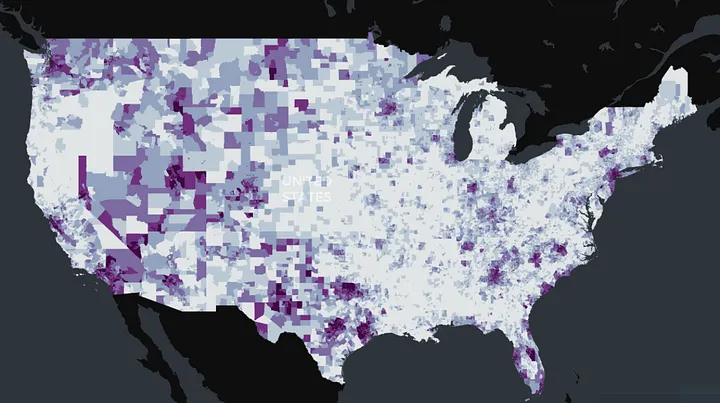
The result is an illustrative map highlighting America’s most attractive markets for commercial development. For a full list of the underlying datasets and features used, please see our product document and methodology paper.
America’s Most Dynamic Commercial Real Estate Markets
Our analysis shows that the West and Sunbelt markets dominate, particular states like California, Texas, Utah, and Florida that offer a combination of economic growth, population inflow, and infrastructure investment.
Deep Dive: America’s Best Retail Markets
Because commercial performance is asset-specific, we refined our analysis to spotlight metros most suited for retail real estate, by placing greater emphasis on the Location Value sub-score.
The Location Value indicator is comprised of datasets that focus on traffic and footfall — key criteria for successful retail investments:
1. Population density: Measure of customer concentration that supports robust retail results
2. Pedestrian and commuter traffic: High footfall is the lifeblood of retail, while high transit traffic signals accessibility
3. Amenity and walkability: A key driver of “flight to quality” for retail
We screened for locations in the top-70th percentile for the following:
1. Overall Commercial Dynamism Score
2. Location Value Sub-score
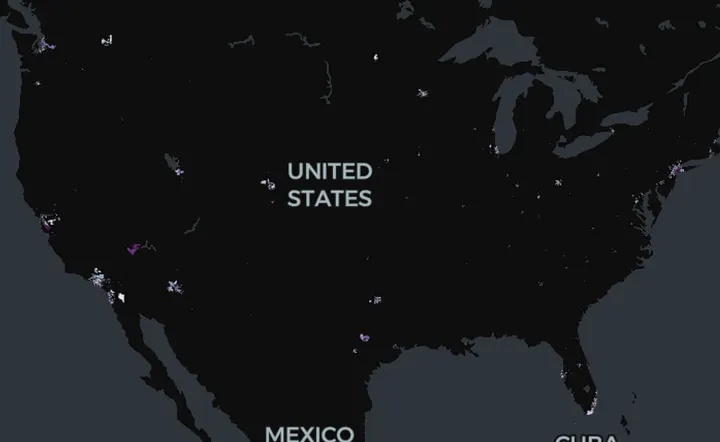
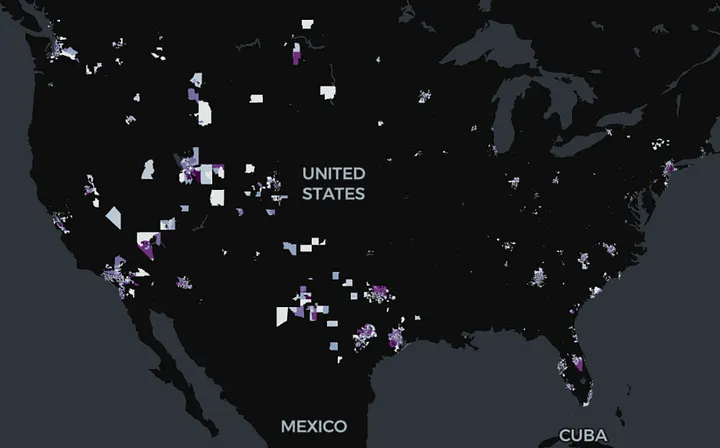
The consequent map skew toward high-density urban centres, with strong representation from major coastal markets and inland metros like Kansas City and Detroit. Smaller or remote boomtowns — especially in the Mountain West — are removed from the list.
Retail Markets of Tomorrow: Integrating Growth Potential
Finally, to ensure we identify retail markets that are both currently attractive, and has the strongest long-term trajectory, we added a third filter: Growth Potential. The Growth Potential sub-indicator assesses the pipeline of future commercial real estate demand, quantifying:
1. Units planned and under construction: Residential construction is a proxy for future retail customer growth
2. Projected population change (proprietary): AlphaGeo’s unique forecast of population growth, integrating emerging factors such as climate migration impact; serves as a proxy for the growth potential of the retail customer base
3. Climate risk (proprietary): Quantifies long-term physical risks to commercial assets
This final filter screens for locations in the top-70th percentile for:
1. Overall Commercial Dynamism Score
2. Location Value Sub-score
3. Growth Potential Sub-score
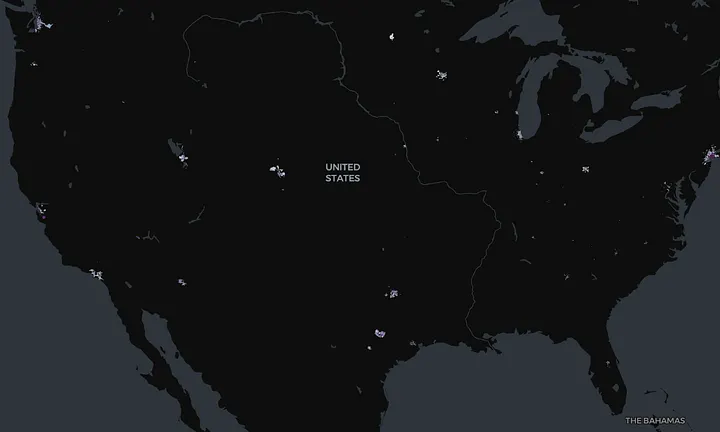
This final step eliminated major coastal metro markets that might have ranked highly on commerce and location quality, but faced growth constraints (e.g., demographic drag, climate risk). These included select CBSAs in dense, mature markets in California (e.g., Los Angeles, San Diego) and Florida (e.g., Miami, Tampa, Cape Coral), as well as potentially overheated Sunbelt markets such as Austin and Nashville.
The top 10 locations in this final list are:
1. New York-Newark-Jersey City, NY-NJ
2. San Francisco-Oakland-Fremont, CA
3. Las Vegas-Henderson-North Las Vegas, NV
4. Seattle-Tacoma-Bellevue, WA
5. San Jose-Sunnyvale-Santa Clara, CA
6. Los Angeles-Long Beach-Anaheim, CA
7. Boston-Cambridge-Newton, MA-NH
8. Dallas-Fort Worth-Arlington, TX
9. Austin-Round Rock-San Marcos, TX
10. Minneapolis-St. Paul-Bloomington, MN-WI
Interested in learning more?
Create a free trial account to conduct your own analysis and access detailed Commercial Dynamism Signals scores for specific locations beyond the high-level map views shown above.
Alternatively, schedule a demo with us today — simply reach out at info@alphageo.ai.