The catastrophe-bond market has never been larger, and its returns have rarely looked better. But the risk underneath those returns is getting harder to model — and that is exactly where an independent, forward-looking, resilience-adjusted view becomes an edge for ILS investors.
How cat bonds work
A catastrophe bond is reinsurance bought from investors instead of from a reinsurer. It works like an escrow account. Investors put up cash. It is locked in a separate legal vehicle for the life of the deal, usually three to five years. The insurer pays a premium for the cover. That premium goes to the investors as income, on top of the interest the cash earns. At the end of the contract, one of two things happens. If a qualifying event occurs, the money goes to the insurer to pay claims and the investors lose it. If none occurs, the investors get it back.
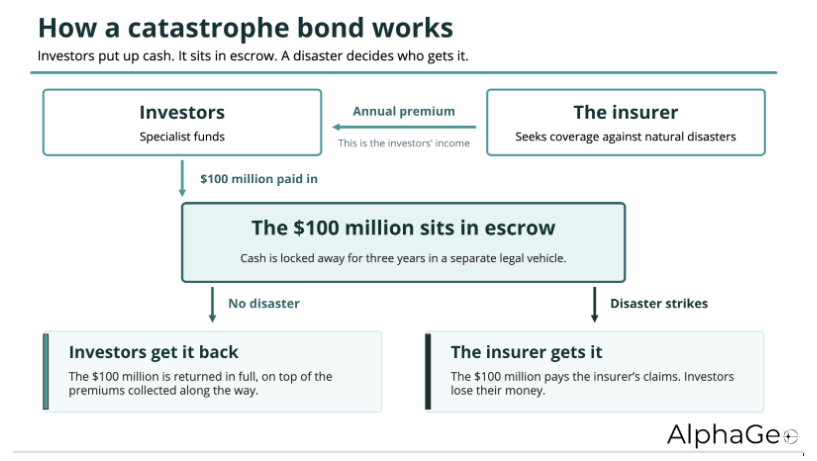
The market has its own words for this: The insurer is the sponsor; the legal vehicle is the issuer; the cash is the collateral; the trigger is the contract’s definition of a qualifying event. Triggers vary, and the choice matters. An indemnity trigger pays on the sponsor’s own claims. An industry-loss trigger pays on a market-wide loss estimate. A parametric trigger pays on a physical reading, such as wind speed or ground acceleration. A modelled-loss trigger pays on the output of a model both sides agreed in advance. The further a trigger sits from indemnity, the faster it settles and the less it tracks what the sponsor actually lost. That gap is basis risk.
Three kinds of institution sponsor these bonds.
- Primary insurers hedge their own books. USAA is the most prolific sponsor in the market’s history. It has issued under the Residential Re name since 1997 and priced its forty-seventh and largest deal at $825 million in 2026, covering US tropical cyclone, earthquake, severe convective storm, winter storm and wildfire on an indemnity basis.
- State insurers of last resort use them when the exposure sits on a public balance sheet. Florida’s Citizens Property Insurance Corporation took $600 million of named storm cover through Everglades Re II in 2026, part of a $2.82 billion risk transfer stack.
- Reinsurers use them to shed risk they have already taken on. This is retrocession, or reinsurance for reinsurers, and it is routine. Swiss Re sponsors regularly under its Matterhorn Re programme, taking $150 million in February 2026 and another $250 million in May. Everest Re has issued under the Kilimanjaro Re name since 2014. It took $1 billion from the market in 2025 and $630 million in 2026, on an industry-loss trigger.
The risk therefore travels in a chain. Policyholder to insurer. Insurer to reinsurer. Reinsurer to the capital markets. Each link prices the same peril, and each is exposed if that price is wrong.
The buyers are a small group. Fermat Capital Management is the largest dedicated ILS manager, with $11 billion in cat bond and ILS assets as of 1 July 2026. Stone Ridge Asset Management held about $7 billion across its mutual ILS funds at the end of June, an all-time high. Behind them are pension funds, endowments and sovereign wealth funds.
Most hold the asset class because they believe its returns move independently of other asset classes.
Every deal rests on the same input. An attachment point, meaning the loss level at which investors start losing money, set against a modelled view of how often and how hard the peril will strike. That view is what is really being sold.
A record market built on a moving target
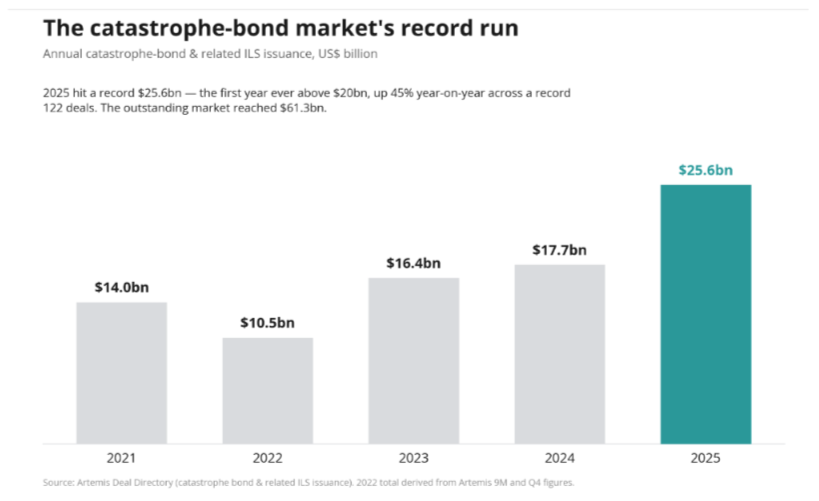
Insurance-linked securities have had a remarkable run. The catastrophe-bond market closed 2025 at a record $61.3 bn outstanding, after a record $25.6 bn of new issuance — the first year ever above $20 bn, up 45% on 2024, and the first to clear 100 separate transactions in a single year. The appeal to investors is structural: cat-bond returns depend on whether hurricanes, quakes, floods and wildfires occur, not on what equity or credit markets do, and many ILS strategies have now delivered three consecutive years of double-digit returns.
That uncorrelated quality rests on an assumption worth examining — that the peril itself can be reliably priced. And the peril is moving.
The models look backwards. The risk is moving forwards.
Catastrophe pricing leans on vendor models calibrated largely on the historical loss record. But the past may be a poor guide to the future. Climate change is steadily pulling the present away from that record, shifting the frequency, intensity and footprint of the hazards these instruments are written against. The clearest evidence is in the so-called secondary perils. Losses in recent years have increasingly come not from headline hurricanes but from severe convective storms, wildfire and hail — perils long treated as modelling afterthoughts. Market analysts now note that US hail alone can rival a major hurricane in insured-loss potential.
The early-2025 California wildfires and the January 2026 Victoria bushfires are recent reminders that loss is arriving through channels models historically underweighted. Cat bonds absorbed the California event with manageable losses, but the lesson for investors is not about any single year. It is that the distribution they are being paid to hold is drifting, and the tools most of the market relies on are slow to reflect it.
There is a second, structural reason this matters now. As issuance has boomed, sponsors have pushed into new perils and new geographies — Australia, New Zealand, Canada, the Caribbean, European windstorm and hail — where model coverage and historical data are thinner than for US wind. And the growth of parametric and trigger-based structures makes the exposure explicit: when Hurricane Melissa struck Jamaica in October 2025 as a Category 5, it was expected to fully trigger the country’s World Bank–arranged parametric cat bond, a total principal loss for bondholders. Basis risk — the gap between the trigger and the real economic loss — is only as sound as the hazard view behind it.
Three points in the ILS workflow where a climate view changes the decision
This is the gap AlphaGeo’s analytics are built to close: an independent, forward-looking, asset-level view of physical climate risk and resilience – spanning selection, monitoring and financial impact.
Risk selection — Climate Risk and Resilience Index and the Global Adaptation Layer
Most physical-risk data measures hazard. AlphaGeo’s Climate Risk & Resilience Index measures hazard and then adjusts it for whether a location is actually adapted, using our Global Adaptation Layer — the first commercially available global database of hazard-specific adaptation capacity, resolved to the asset level. Scored across IPCC scenarios and time horizons out to 2100, it gives ILS investors a forward-looking second opinion to sit alongside vendor cat models: a way to separate exposures that look identical on paper but are differently protected on the ground, and to see where modelled risk may over- or under-state the real thing.
Live monitoring — Hazard Alert
Traditional models tell you what a location’s risk looks like over decades; they do not tell you a storm is bearing down this week. Hazard Alert closes that gap, drawing on government and scientific hazard feeds to flag active and forecast events — up to seven days ahead — matched to the specific assets and regions in a book. For an ILS portfolio, that means live-cat tracking, an earlier read on which positions and triggers are exposed, and faster, better-informed decisions while an event is still developing.
Financial impact — Climate Price
Many ILS investors — particularly the multi-strategy funds active in the space — also run climate-exposed corporate credit and equity. Climate Price extends the same physical-risk lens to those books, translating hazard into issuer-level EBITDA-at-Risk through six transmission channels, including climate-driven insurance-cost inflation, with full attribution back to individual facility and hazard. It connects the catastrophe view to the corporate exposures sitting elsewhere in the same fund.
Targeting resilience — the Asset Resilience Checklist
The same asset-level view extends to the owners of the assets themselves. The Asset Resilience Checklist lets a property owner assess their own resilience gap directly, so support can be aimed where it buys down the most risk — the capability that becomes central to the resilience-financing use we turn to.
Why it matters now
The market is softening from its 2023 peak even as it grows, which puts a premium on selection: when spreads compress, the edge comes from knowing which risks are genuinely mispriced rather than simply cheap. A forward-looking, resilience-adjusted, asset-level view of physical climate risk is precisely the analysis that supports that judgement — at the point of selection, through the life of an event, and across the adjacent exposures a fund already holds.
From pricing the peril to funding the fix
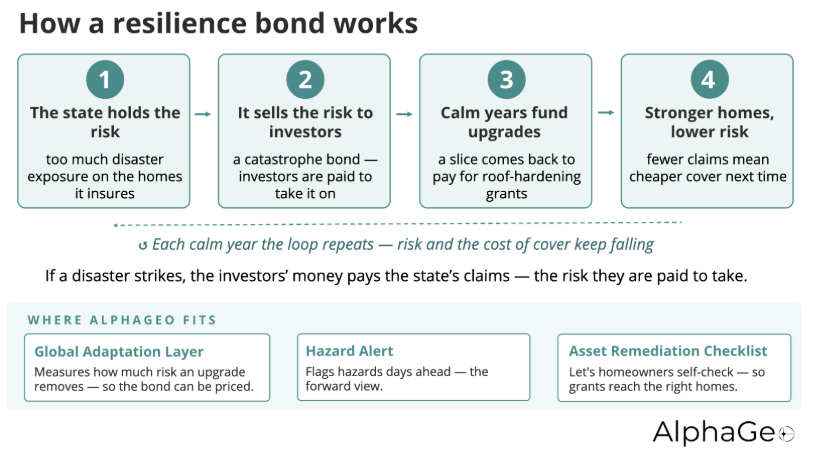
The cat-bond market is beginning to do something more ambitious: pay to reduce the risk. In 2025, North Carolina’s state insurer of last resort issued Cape Lookout Re, the first catastrophe bond with a built-in resilience feature. The bond carves out a small “resilience spread.” In years without major losses, roughly $2 million of interest flows back to the state, earmarked for grants that help homeowners install wind-resistant roofs — and as more hardened roofs enter the book, the bond reprices to reflect the lower risk. The money for prevention comes from the savings that prevention creates, not from the collateral, which stays put like any cat bond.
The result is a loop that funds itself: hardened homes cut expected claims, fewer claims lower the cost of transferring the risk, and the savings fund more hardening. It works because North Carolina had the record to prove it — more than $130 million invested in resilient construction and over 20,000 fortified roofs, with the claims data to show that hardening pays for itself.
Nothing in the mechanism is specific to wind. The same logic — an evidence-based link between a mitigation and the losses it prevents — extends to wildfire, flood and hail. And it matters more each year as private insurers retreat from the riskiest coasts and wildland edges, leaving more households to depend onto state insurers of last resort.
The resilience trigger, unpacked
The mechanism that moves the money is called a resilience trigger because it is the first place a catastrophe bond has been asked to price prevention rather than just loss.
Start with the layer itself. Cape Lookout Re asks investors to cover NCIUA losses above $2.8 billion. Every named storm causing at least $25 million of damage adds to a running total across a 12-month risk period, and only when that total passes $2.8 billion does investor principal begin to pay. Reaching that level is what the market calls attaching. Below it, investors are untouched.
Two premium payments, not one
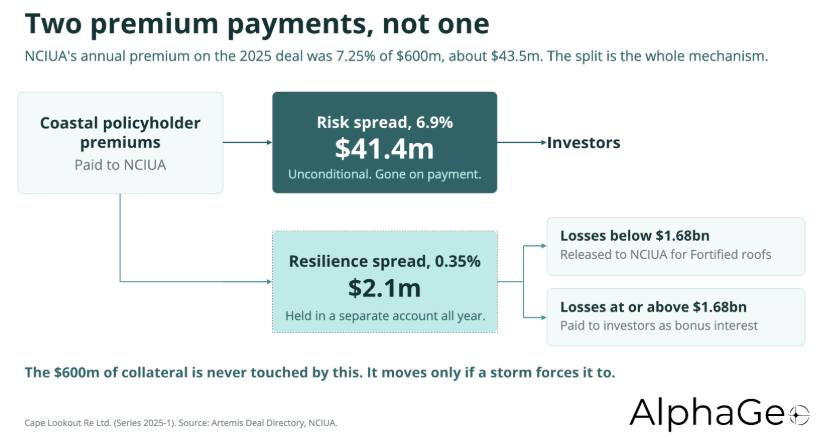
Each year NCIUA writes a premium check to keep the cover in place. On the 2025 deal that check was 7.25% of $600 million, roughly $43.5 million. It splits in two:
The risk spread. 6.9%, about $41.4 million. This goes straight through to investors. It is unconditional, gone the moment it is paid, and nothing that happens during the year changes that.
The resilience spread. 0.35%, about $2.1 million. This does not go to investors. It goes into a separate account inside the issuing vehicle and sits there, earning interest, for the entire risk period. Nobody owns it yet.
Both come from the same place, premiums paid by coastal North Carolina policyholders. The resilience spread is not a grant, not state money, and not carved out of the $600 million of collateral, which stays put like any cat bond. It is the last 0.35% of an ordinary reinsurance premium, held back instead of handed over.
The line at 60 percent
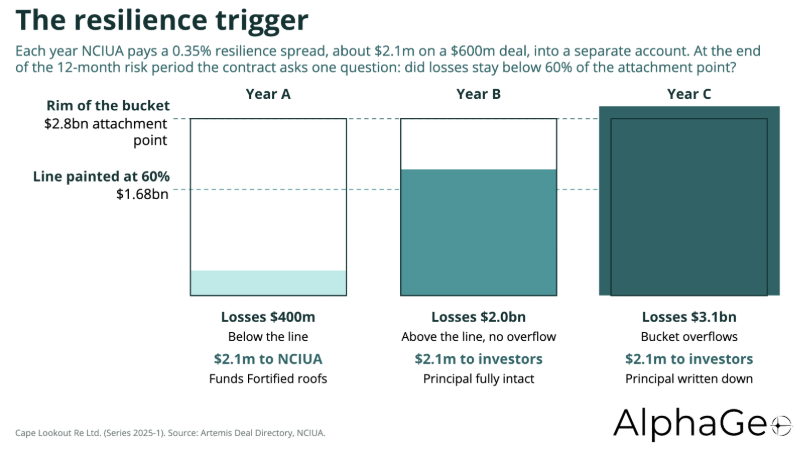
A second threshold sits below the attachment point – at 60% of it. On the 2025 deal that line falls at $1.68 billion. At the end of each risk period the contract asks one question, and it is not whether the bond attached. It is whether aggregate losses stayed below that lower line.
Below the line. A resilience trigger event has occurred. The accumulated spread and its interest are released to NCIUA, ring fenced for IBHS Fortified Roof grants or for upgrading a damaged roof to Fortified standard during a claims process.
At or above the line. No resilience trigger event. The same money is paid to investors instead.
Two things this is not. It is not a measure of weather, and it is not a monthly test. Nobody counts storms or reads wind speeds. Dollars of damage are added up across a full year, so a season of twelve moderate storms can cross the line while a single large one might not.
Three years, walked through
A quiet year, losses of $400 million. Well below the line. Investors keep all $600 million and collect their premium as normal. The resilience spread is released to NCIUA and roughly $2.1 million goes to Fortified Roof grants.
A rough year that never attaches, losses of $2.0 billion. Losses climbed past the line but never reached the attachment point. Investors lost nothing at all and their principal is fully intact. Because the line was crossed, no resilience trigger event occurred, so the spread goes to them as bonus interest. NCIUA gets no roof money that year.
A catastrophe, losses of $3.1 billion. The layer attaches and investors lose principal to pay claims. Losses are also above the line, so investors take the resilience spread as well.
The middle case is the one that makes the structure work. Investors spent twelve months watching losses climb to within $800 million of their money and walked away untouched. The resilience spread is what they collect for the near miss.
Why investors were willing to buy it
On an annual aggregate structure the real anxiety is not a single hurricane. It is erosion creeping upward across a season with no compensation for the deterioration. The resilience spread arrives precisely in the years when that erosion has become material, so investors hold what amounts to a small knock out coupon struck at 60% of their attachment point.
They also give it up only in the years they were never at risk, and what it funds reduces the hazard they are exposed to in years two and three of the same three-year deal. Every Fortified roof installed is a roof that adds less to the following season’s total.
The market response bears this out. NCIUA came to market in 2025 targeting $350 million and secured $600 million, priced below the midpoint of guidance. It returned in 2026 targeting $400 million, secured $600 million again, and priced at the bottom of a reduced range. Market reporting attributed the strength of that execution in part to the resilience features.
Why the sponsor gives up money it might have kept
The obvious objection is that this looks circular. NCIUA pays $2.1 million in order to possibly get $2.1 million back. Three things answer it.
Routing the money through the bond contract makes the spending non-discretionary. It is written into a securities document, held inside the issuing vehicle and released only for a named purpose, so it cannot be quietly redirected when next year’s budget tightens.
It also buys execution. NCIUA pays 35 basis points to widen its investor base, and if that reception shaves even 15 basis points off the main risk spread, the feature is close to self- funding before a single roof is installed. In quiet years the money returns on top of that.
And it lowers the cost of the next deal. Fortified roofs cut losses, lower losses mean a cheaper reinsurance tower, and the savings fund more hardening. The resilience trigger is the plumbing that keeps that loop fed.
Whether the roofs work
The evidence is unusually direct, because NCIUA generated it from its own book. Working with North Carolina State University’s Institute for Advanced Analytics, it analyzed claims from Hurricanes Matthew, Florence, Dorian and Isaias. Homes with a Fortified Roof filed about 35% fewer claims, and when a claim was filed the damage was roughly 23% less severe. A separate finding put the reduction in claims from non-named storms at 63%.
Fortified is an above code standard requiring stronger roof deck attachment, sealed roof decks and locked down edges, with every installation independently verified by a third party. NCIUA has assisted more than 18,000 policyholders to one since adopting the standard in 2016, representing more than $120 million invested, funded largely from its own surplus.
That last figure supplies the necessary context. At $2.1 million a year the resilience trigger is not really a funding mechanism, since NCIUA was already spending roughly ten times as much without it. What the trigger does is make a slice of that spending contractual, visible to the capital markets and priced. It turns mitigation from a line item in a residual market’s budget into a term that ILS investors underwrite and bid on. That, rather than the dollar amount, is the innovation.
What the trigger does not test
NCIUA embedded the same feature in a second deal in March 2026, upsizing a $400 million target by half to $600 million across two tranches, and the fronting reinsurer has said it is in discussions with other sponsors and sees wildfire, earthquake and flood as candidate perils. Replication, though, runs into something the structure does not solve.
The resilience trigger tests loss experience. It does not test resilience. The contract asks whether the year was quiet, never whether last year’s money bought down risk. Nothing measures the risk reduction achieved, third party verification confirms that a roof meets the standard rather than what it removes, and nothing directs the grants toward the homes where a retrofit would remove the most.
The threshold carries a second dependency. Because the 60% line is defined as a fraction of the attachment point, and the attachment point comes out of a vendor model calibrated on the historical loss record, the resilience threshold inherits every weakness of that model. If the model understates hazard, the line sits too high and the money releases in years that were riskier than the model believed.
Neither problem is visible in North Carolina, because NCIUA owned four hurricanes of matched claims data on a single standardized intervention. That evidence base, not the financial engineering, is the binding constraint on replication. For wildfire, flood or earthquake there is no equivalent of the Fortified standard with an accepted loss reduction elasticity behind it, and no sponsor with two decades of matched claims to establish one. Closing that gap requires a forward looking, asset level measure of how much protection a given intervention buys at a given location, independent of whether the sponsor happens to have lived through four storms with the data to prove it.
The public data layer is thinning at the same time
The observational and research infrastructure most of the market treats as free background is under sustained budget pressure. The US administration’s fiscal 2026 request proposed cutting the National Oceanic and Atmospheric Administration (NOAA) by roughly a quarter, about $1.7 billion, and outright eliminating the Office of Oceanic and Atmospheric Research (OOAR), NOAA’s research arm. The request carried the line “Total, Climate Research: $0.” It proposed defunding all climate, weather and ocean Laboratories and Cooperative Institutes, along with Regional Climate Data and Information, Climate Competitive Research, the National Sea Grant College Program and the National Oceanographic Partnership Program and reducing NOAA’s full-time staff by more than 2,000. It also proposed major reductions at the National Centers for Environmental Information and the National Environmental Satellite, Data, and Information Service.
Congress pushed back on a bipartisan basis. The Senate Appropriations Committee added $68.7 million to the Operations, Research and Facilities account and landed NOAA near flat at about $6.14 billion, against $6.18 billion the year before. The fiscal 2027 request returned with more than $1 billion in cuts and a second attempt to eliminate OAR, which NOAA Administrator Neil Jacobs defended at an April 2026 hearing by arguing the research would be transferred to the National Ocean Service and the National Weather Service.
Some changes went ahead regardless of the appropriations outcome. NOAA cut roughly $100 million from OAR in fiscal 2025 as what officials described as a down payment on the larger plan. Defense Meteorological Satellite Program data used in hurricane monitoring was withdrawn from researchers in mid-2025 after a short extension. And the National Centers for Environmental Information, the largest public archive of weather and climate data in the world, stopped updating its Billion-Dollar Weather and Climate Disasters catalogue beyond 2024. For three decades that series was the default public reference for US catastrophe loss frequency and the starting point for a great deal of trend work, academic and commercial alike.
On the mitigation side, the Federal Emergency Management Agency cancelled Building Resilient Infrastructure and Communities in April 2025. BRIC was the largest competitively awarded pre-disaster mitigation program in the country, created by Congress under the Disaster Recovery Reform Act of 2018, with more than $5.7 billion available. FEMA rescinded the $750 million fiscal 2024 funding opportunity, moved to cancel applications from fiscal 2020 through 2023, and stated that roughly $882 million appropriated under the Infrastructure Investment and Jobs Act would return to the Treasury. Flood Mitigation Assistance funding for 2025 was removed at the same time. Twenty-two states and the District of Columbia sued. A federal judge ruled in December 2025 that FEMA could not eliminate the program, FEMA resumed it in March 2026 with $1 billion and new rules shifting more responsibility onto states, and motions to enforce the original order were still being filed in February 2026.
The premium on quality data has never been higher
Set those developments beside each other and the shape of the problem is clear. Year-to-year variance in catastrophe loss is widening. The public observation and research infrastructure that measures it is contested, and in the case of the billion-dollar disaster series has simply stopped updating. And the public money for reducing that loss has spent eighteen months moving through the courts.
None of this requires an ILS investor to hold a view on federal budget policy. It requires only the recognition that the hazard view is no longer going to arrive from somewhere else, fully formed and free. When the next few years are genuinely uncertain and the shared reference data is no longer reliably maintained, an independent, forward-looking view of the peril stops being a supplement to the vendor model and becomes the difference between investors pricing true risk versus pricing last decade’s record of it.
It also raises the stakes on the structure described above. The resilience spread inside Cape Lookout Re is mitigation funding that does not route through an appropriation. It is contractual, it is priced, and it survives a change of administration because it lives in a securities document rather than a budget line. If public pre-disaster funding is going to be this volatile, then private structures that pay for prevention out of the risk transfer itself stop being a curiosity and start being infrastructure. A structure that lowers the underlying risk is worth considerably more than one that only finances the aftermath.
Where AlphaGeo data fits in
The resilience bond only works if three questions can be answered credibly — and they map onto the AlphaGeo tools introduced above, pointed at a different job. The Global Adaptation Layer measures how much risk a given retrofit actually removes at a location: the number the resilience feature has to be priced on. Hazard Alert supplies the forward view that makes pre-emptive spending possible. And the Asset Resilience Checklist lets homeowners assess their own resilience gap, so the subsidy targets the homes where it buys down the most risk. Together they turn a financial structure into adaptation on the ground — measure the capacity, see the threat, target the spend.
Uncorrelated does not mean unpredictable. The investors who price the peril most clearly, and the issuers who use the same market to fund resilience, will be the ones who stop treating the historical record as the last word on it.