This article is the second in a series identifying America’s most dynamic real estate markets. For our analysis of the residential real estate market, please see here. To score, rank, and stress-test your invested market for location dynamism, explore a free trial of our platform here: app.alphageo.ai/trial_setup.

“Location, location, location” — the age-old real estate mantra — remains as true today as ever. But the process of identifying prime locations has evolved far beyond gut instinct. Today, investors have access to a wealth of data and predictive analytics tools, offering unprecedented precision in pinpointing optimal markets for their next investments.
This abundance of data, however, creates its own challenge: a complex and often overwhelming analytical landscape. The ability to separate meaningful signals from background noise has become increasingly crucial. This article aims to achieve exactly that. We distill the key factors driving industrial real estate dynamism and leverage these criteria to spotlight America’s most promising markets for industrial real estate developers and investors.
The Industrial Dynamism Signal
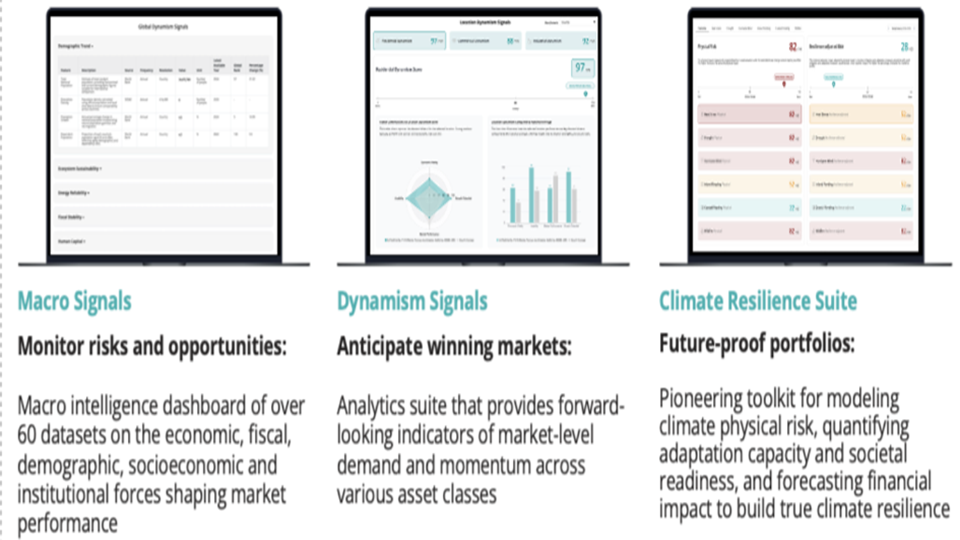
To that end, AlphaGeo has developed the Industrial Dynamism Signal — a composite indicator engineered to help identify locations optimally configured for logistics, manufacturing, and data infrastructure. The Industrial Dynamism Score is built on a curated set of around 15 datasets, consolidated into four key sub-indicators:
- Logistics: This indicator measures the quality of physical infrastructure that enables the efficient movement of goods, using data on highway, rail, and air connectivity, as well as energy resilience through micro-grid capacity.
- Workforce Accessibility: This indicator consolidates data on the health, size, and suitability of the local labor market for industrial employers.
- Operational Efficiency: This indicator quantifies key input costs and infrastructure quality factors that directly impact an industrial tenant’s profitability, such as electricity rates, grid reliability, and internet speed.
- Growth Potential: This indicator identifies signals of future industrial expansion and innovation through our proprietary greenfield investment tracker, local patent activity, and our long-term climate risk score.
While sector-specific strategies (e.g., core vs. opportunistic, logistics vs. data centers) may require bespoke weighting of these sub-indicators, this framework offers a comprehensive starting point for evaluating industrial real estate markets broadly.
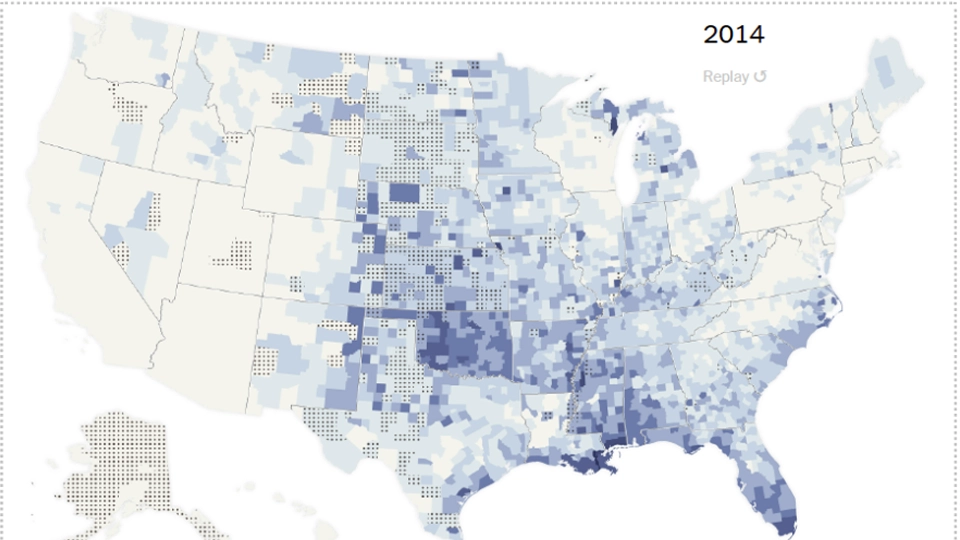
The result is an illustrative map highlighting America’s most attractive markets for industrial development. For a full list of the underlying datasets and features used, please see our product document and methodology paper.
America’s Most Dynamic Industrial Zones

Our data reveals that the most dynamic industrial markets (those in the top 70th percentile of the Industrial Dynamism Signal) are concentrated in:
- The Upper Midwest (OH, IL, IN, MI)
- The Northeast Corridor (NY, NJ, MA)
- California (with the most geographically varied high-performing zones)
- The Pacific Northwest
- Select fast-growing inland hubs such as Utah and Texas
Measuring Industrial Growth Potential
One of the key components of the Industrial Dynamism Signal is the Growth Potential sub-score. This forward-looking indicator is based on three criteria — two of which are proprietary:
- Greenfield Investment: A proprietary tracker of new corporate investment, capturing momentum in industrial expansion.
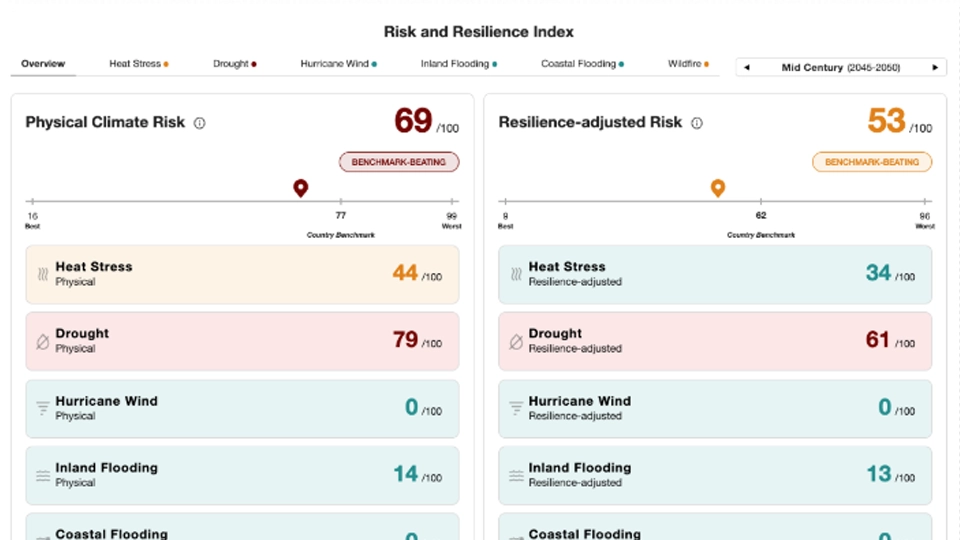
- Climate Risk: A long-term physical risk score for industrial assets and supply chains.
- Patents per Capita: A proxy for local innovation, reflecting growth in high-value industrial sectors.
While California unsurprisingly dominates this metric, high-performing CBSAs also emerge from the Great Lakes and Midwest Corridor, the Northeast, and the Pacific Northwest.

Bringing it Together — Tomorrow’s Most Promising Industrial Hotspots
Using the Growth Potential sub-score above, we applied a dual filter to identify markets that combine strong current performance with long-term potential:
- Industrial Dynamism Score: Top 70th percentile
- Growth Potential Sub-score: Top 70th percentile
This step eliminated slightly more than half of the locations that ranked highly on overall dynamism alone. The resulting list includes locations that not only excel today but are well-positioned for future industrial growth, with the top-performing census tracts concentrated especially in Ohio, California, and New York. Of these, the top-performing CBSAs are:
- Chicago-Naperville-Elgin, IL-IN
- Seattle-Tacoma-Bellevue, WA
- Los Angeles-Long Beach-Anaheim, CA
- Dallas-Fort Worth-Arlington, TX
- Columbus, OH
- Houston-Pasadena-The Woodlands, TX
- Pittsburgh, PA
- Phoenix-Mesa-Chandler, AZ
- Philadelphia-Camden-Wilmington, PA-NJ-DE-MD
- Portland-Vancouver-Hillsboro, OR-WA

Interested in learning more?
Create a free trial account to conduct your own analysis. Access detailed Industrial Dynamism Signals scores for specific locations beyond the high-level map views shown above.
Alternatively, schedule a demo with us today — simply reach out at [email protected].