| Key takeaways Builders capture resilience at the point of sale. Across 35 US metros, lower residual climate risk goes with higher home prices relative to trend. Building where people will want to live, and where homes stay insurable, means selling into that premium. The top 10 builders’ footprints vary. We masked the names of the 10 largest US homebuilders and ranked them #1 to #10 by the climate resilience of their core markets. Builder #1 has the most resilient footprint. Builder #10 has the least, with 56% of its core markets in the highest residual-risk band. Texas, not Florida, carries the highest residual risk. Florida’s building codes absorb much of its hurricane exposure. Hail across Dallas, Austin and San Antonio goes largely unmitigated. |
Homebuilders do not hold their homes for decades. They buy land, build and sell, and their exposure largely ends at closing. So why should long-term climate risk matter to them? Because buyers, lenders and insurers price it in at the point of sale. Homes in places where people want to live, and where insurance stays affordable, hold their value. As those locations appreciate, builders can sell for more. We call this the resilience premium.
AlphaGeo was built to find it. As Michael Ferrari wrote in Bringing GeoSense to Real Estate, our first clients were builders and developers looking for where and why to deploy capital under climate uncertainty. We applied the same lens to the 10 largest US homebuilders and the country’s top-selling master-planned communities.
How we scored the builders
We took the 10 largest US homebuilders by home closings, masked their names and ranked them #1 to #10 by the resilience of their locations. To do this, we mapped each builder’s core operating markets and scored a representative new-construction location in each one. We used AlphaGeo’s Climate Risk & Resilience Index (CRRI) for 2050 under a middle-of-the-road emissions scenario (SSP2-4.5). Each location receives 2 scores:
- Physical Risk Score: Raw hazard exposure across 9 perils, from hurricane wind to wildfire. Higher is worse.
- Resilience-Adjusted Risk (RAJ) Score: The risk that remains after local adaptation such as building codes, flood defenses and emergency infrastructure. Lower is better.
A builder’s score is the average RAJ Score across its core markets. A lower score means more of its homes are being built where the resilience premium is likely to hold.
The ranking
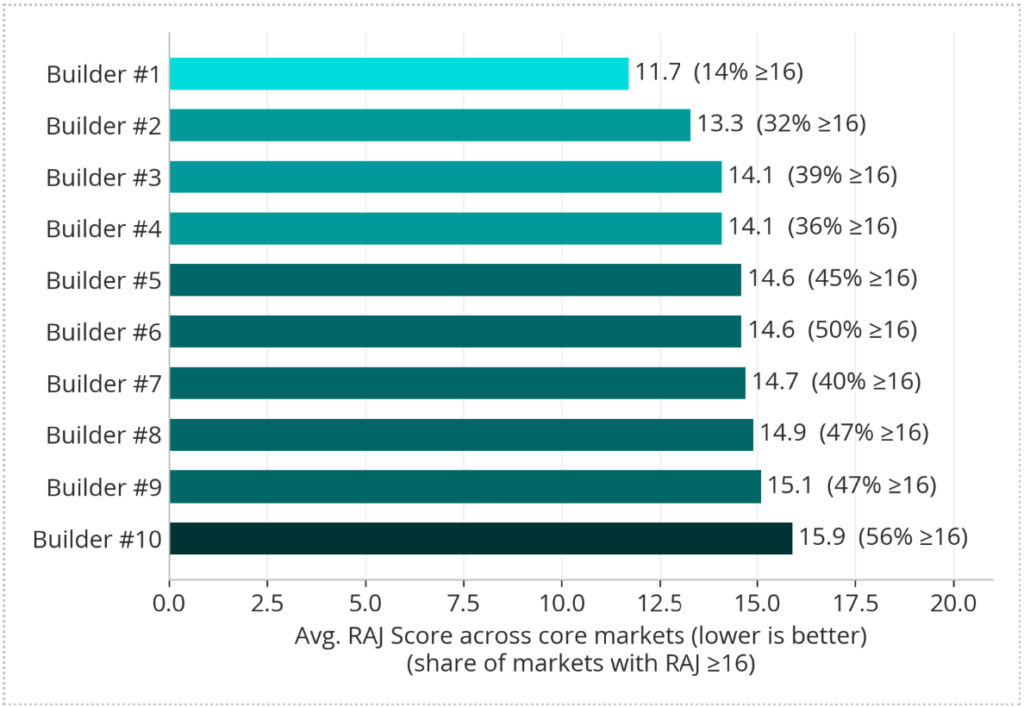
Table 1. Climate footprint of the 10 largest US homebuilders (names withheld)
| Builder | Markets scored | Avg. RAJ Score (0–100) | Avg. risk score (0–100) | Markets with RAJ ≥16 (%) |
|---|---|---|---|---|
| Builder #1 | 14 | 11.7 | 15.9 | 14% |
| Builder #2 | 25 | 13.3 | 19.0 | 32% |
| Builder #3 | 23 | 14.1 | 20.2 | 39% |
| Builder #4 | 22 | 14.1 | 20.5 | 36% |
| Builder #5 | 20 | 14.6 | 20.7 | 45% |
| Builder #6 | 18 | 14.6 | 20.7 | 50% |
| Builder #7 | 20 | 14.7 | 21.6 | 40% |
| Builder #8 | 17 | 14.9 | 20.5 | 47% |
| Builder #9 | 17 | 15.1 | 21.8 | 47% |
| Builder #10 | 16 | 15.9 | 22.9 | 56% |
Builder #1 leads by a wide margin. Only 14% of its markets fall in the high-risk band, and most of them score between 8 and 13 on RAJ.
Builder #10 ranks last for a structural reason. More than half its markets sit in the highest residual-risk band, concentrated in Texas, Phoenix and Las Vegas.
Builder #2 ranks second because its exposure to lower-risk markets offsets its Sun Belt growth. The middle of the table is tightly packed: Builders #3 to #6 sit within half a point of each other.
The surprise: Texas, not Florida
Conventional wisdom puts Florida at the top of climate risk rankings. Our data shows that Texas and the desert Southwest have the highest residual risk among builder markets. Dallas scores 22 on RAJ, Austin and San Antonio 21, Phoenix 19.5 and Houston 18. Every Florida growth location we scored came in at 16 or lower.
The difference is adaptation:
- Florida absorbs much of its risk. Inland Florida sites face hurricane wind scores of 60 to 70. Strict building codes and storm infrastructure cut residual wind risk roughly in half.
- Texas hail goes largely unmitigated. Hail scores 100 in McKinney, Liberty Hill and northwest San Antonio, and adaptation barely moves it. Santa Rita Ranch outside Austin absorbs just 13% of its risk. Babcock Ranch in Southwest Florida absorbs 45%.
- The desert’s problem is water and fire. Drought and wildfire scores of 80 to 100 drive the results in Phoenix and Las Vegas.
For builders, this shows up at the point of sale: in the buyer’s insurance quote, the lender’s underwriting and the price a home can command. Hail is a product-specification problem, and it is solvable with impact-rated roofing and materials.
Where the volume is going: The top MPCs
Zonda’s 2025 ranking of top-selling master-planned communities (MPCs) put 10 of the top 25 in Florida, with Texas and Nevada close behind. We scored 16 of them.
Table 2. Climate scores for 16 top-selling master-planned communities
| Community | Metro | RAJ Score (0–100) | Risk score (0–100) | Main residual driver |
|---|---|---|---|---|
| Babcock Ranch | Punta Gorda, FL | 11 | 20 | Hurricane wind |
| Great Park Neighborhoods | Irvine, CA | 11 | 19 | Earthquake |
| Lakewood Ranch | Sarasota, FL | 12 | 20 | Hurricane wind |
| The Villages | Central Florida | 13 | 18 | Hurricane wind |
| Wellen Park | Venice, FL | 13 | 22 | Hurricane wind |
| Westview | Kissimmee, FL | 14 | 22 | Hurricane wind |
| Summerlin | Las Vegas, NV | 14 | 26 | Drought, wildfire |
| Two Rivers | Tampa, FL | 16 | 23 | Hurricane wind |
| Cane Bay Plantation | Charleston, SC | 16 | 22 | Earthquake |
| Sunterra | Houston, TX | 17 | 23 | Hail |
| Bridgeland | Houston, TX | 19 | 23 | Hail |
| Cadence | Henderson, NV | 19 | 31 | Wildfire, drought |
| Superstition Vistas | Phoenix, AZ | 19 | 30 | Drought, wildfire |
| Asante | Surprise, AZ | 20 | 31 | Drought, wildfire |
| Santa Rita Ranch | Austin, TX | 21 | 24 | Hail |
| Painted Tree | McKinney, TX | 22 | 31 | Hail, inland flooding |
Florida’s flagship communities cluster at the resilient end of the table. The Texas hail belt and the desert Southwest hold the highest scores, including several of the fastest-growing new entrants on Zonda’s list.
Is the resilience premium priced in?
We compared each metro’s RAJ Score with how far its home values sit above their long-term trend. The price premium comes from AlphaGeo analysis of Zillow’s Home Value Index, modeled on the Beracha and Johnson Housing Ranking Index. The 2 measures move in opposite directions (correlation of -0.35): lower residual risk correlates with higher future prices. The market already pays a resilience premium, but unevenly.
Figure 2. Residual climate risk versus home value premium, 35 US metros
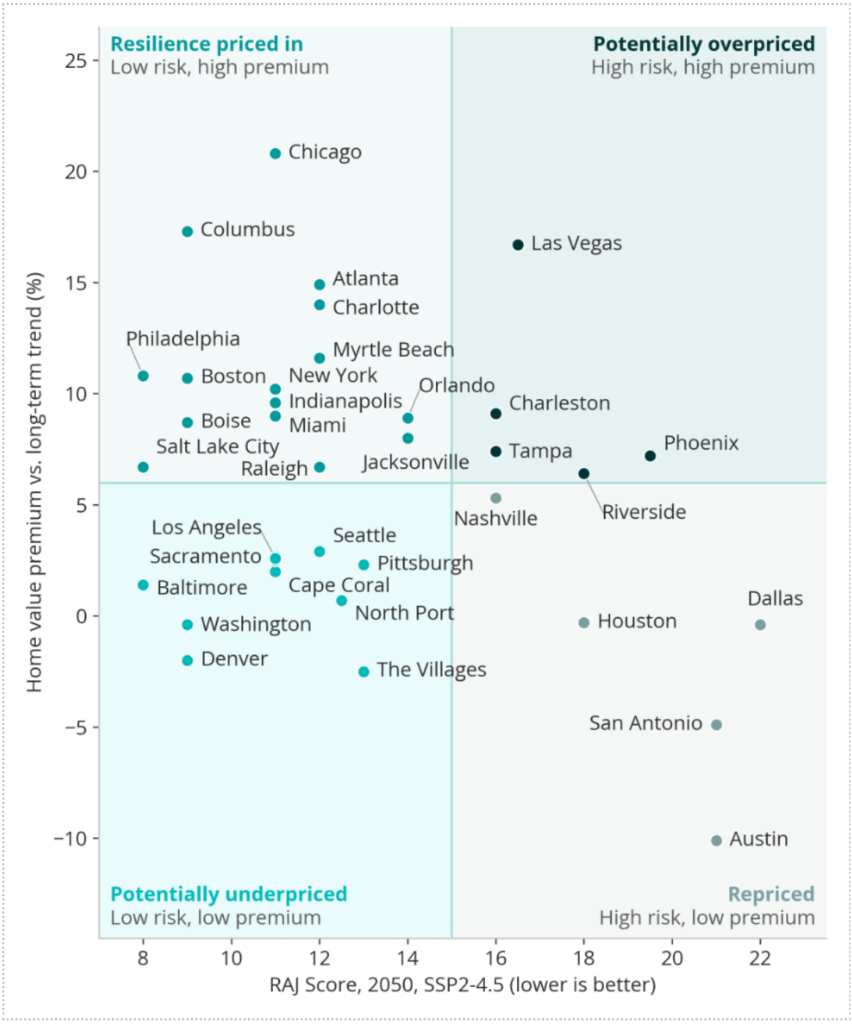
Potentially overpriced: High residual risk, prices above trend
- Las Vegas: RAJ Score 16.5, premium of 16.7%.
- Charleston: RAJ Score 16, premium of 9.1%.
- Tampa: RAJ Score 16, premium of 7.4%.
- Phoenix: RAJ Score 19.5, premium of 7.2%.
- Riverside: RAJ Score 18, premium of 6.4%.
Potentially underpriced: Low residual risk, prices at or below trend
- Denver: RAJ Score 9, discount of 2.0%.
- Washington: RAJ Score 9, discount of 0.4%.
- Baltimore: RAJ Score 8, premium of 1.4%.
- Sacramento: RAJ Score 11, premium of 2.5%.
- Sarasota and North Port: RAJ Score 12.5, premium of 0.7%.
Resilience priced in, and the repriced
Chicago (RAJ Score 11, premium of 20.8%) and Columbus (RAJ Score 9, premium of 17.3%) already command a premium for low risk. At the other end, Austin, San Antonio and Dallas now trade at or below trend despite the highest RAJ Scores in our sample.
For builders, the opportunity sits in low-RAJ markets still trading near trend, where the resilience premium has room to grow before homes are sold. The caution sits in high-RAJ markets still carrying a premium, which could narrow between land purchase and sale.
What builders should do with this
- Buy land where the resilience premium will accrue. Low residual risk and prices near trend point to locations with room to appreciate by the time homes sell.
- Score sites, not just metros. A portfolio-level view hides the spread between communities. Babcock Ranch and Painted Tree are 11 points apart on RAJ.
- Specify for the dominant residual peril. Hail-rated roofing in Texas, water-efficient design in the desert and wind-rated envelopes in Florida. A home that is cheaper to insure is easier to sell.
- Sell the resilience. Buyers, insurers and mortgage lenders are all pricing risk more closely, and resilient homes give sales teams a concrete story.
AlphaGeo’s Climate Resilience Suite scores any parcel or community pipeline at address level, across 3 emissions scenarios and multiple time horizons. Financial Impact Analytics translates that risk into insurance, maintenance and value impacts. Book a demo to see how your land pipeline ranks.
Methodology
The 10 builders are the largest US homebuilders by home closings; names are withheld and each builder is labeled by its rank, #1 (most resilient footprint) to #10 (least). Builder footprints reflect each company’s core homebuilding markets as disclosed in public filings and company materials. Markets are equally weighted. Each metro is scored at a single representative new-construction location; where we scored 2 MPCs in one metro, we used their average. CRRI scores are for 2050 under SSP2-4.5 (data version November 2025). Price premiums are the percentage gap between each metro’s August 2026 Zillow Home Value Index and its log-linear trend since 2000.
References
AlphaGeo (2026). Climate Risk & Resilience Index. AlphaGeo platform.
Ferrari, M. (2024). Bringing GeoSense to Real Estate: The Spatial Finance Lens for Public Markets. AlphaGeo Insights.
Zonda (2025). The 25 Top-Selling U.S. Master-Planned Communities of 2025. Builder Magazine.
Zillow (2026). Zillow Home Value Index (ZHVI), metro level. Zillow Research.
Beracha, E. and Johnson, K. (2026). The Beracha and Johnson Housing Ranking Index. American Real Estate Society.
This report is provided for informational purposes only and is not for redistribution, resale, or sublicensing. AlphaGeo analytics are intended for internal decision support and may be shared with clients but not commercialized without AlphaGeo’s prior written consent. See AlphaGeo Legal Items & Disclosures.