This AlphaGeo authored piece was originally published in AFIRE’s Summit Journal.
Read it here: https://www.afire.org/summit/fivemaps/
In complex systems, the past is a poor guide to the future.
It is more than usually relevant to the question of how to invest in US real estate today. Trump’s tariffs, the most restrictive immigration posture in a generation, an industrial reindustrialization push, fragile grids, and a climate-and-insurance reset are colliding in real time.
Linear models built on the last cycle will not catch what comes next.
Our approach is to treat real estate the way a complex systems theorist would treat any dynamic landscape: by layering wide data — market, macro, demographic, environmental — and resolving it geospatially to the level where investment decisions are actually made. The point is not to forecast the world, but to surface the places where multiple forces converge to make a thesis high-conviction.
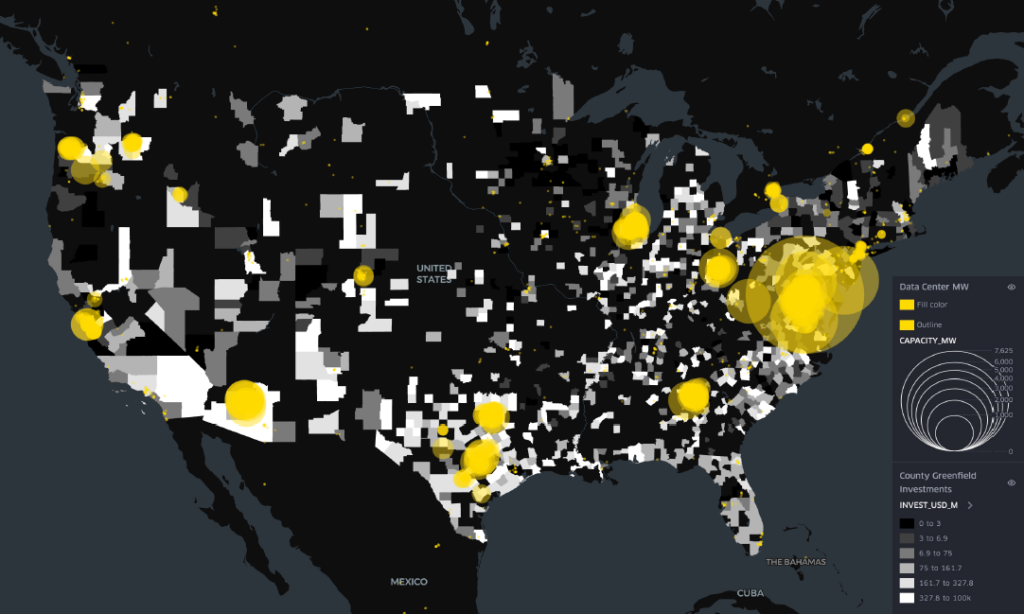
Map 1: The Industrial Renaissance
Map 2: Where America Is Under Stress
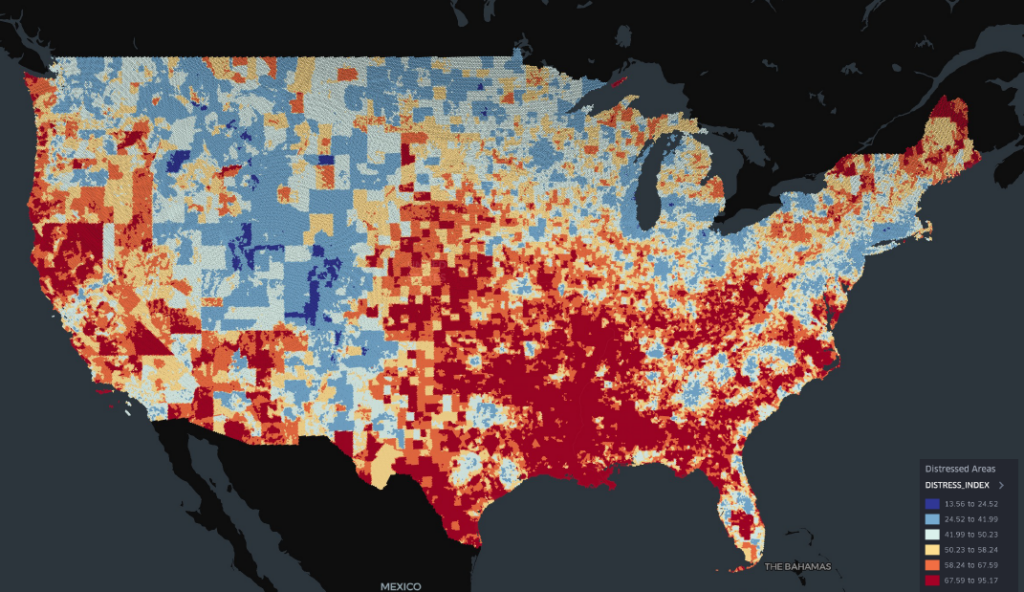
The second map turns the lens 180 degrees and asks where structural distress is concentrating. We indexed every census tract on more than twenty underlying factors across three dimensions:
Market dynamism (residential, commercial, industrial): Based on predictive real estate Market Dynamism Signals spanning Residential, Commercial and Industrial assets.
Population growth: Based on a proprietary population growth forecast.
Climate exposure: Including both overall climate risk to 2050 and our proprietary probability-of-climate-default measure.
The most distressed locations cluster across the Gulf Coast, the Deep South, and parts of the Southwest. Systemic risk is widespread across the rural South. The least distressed locations sit in Utah, Colorado, and Idaho, with secondary pockets in the Northeast and Upper Midwest. This is not the full investment picture — least distress is not the same as strongest forward momentum — but it is a good place to start screening downside.
Map 3: Risk Is Not Destiny
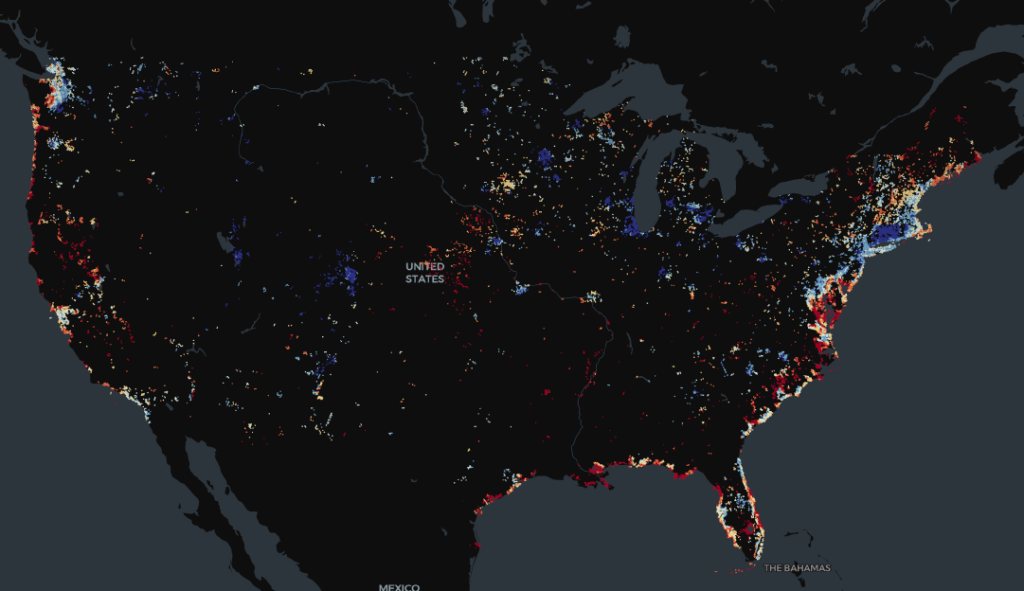
Distress alone tells you what to avoid. Resilience tells you where to look inside the distressed zones for asymmetric value. The third map filters Map 2 by climate adaptation capacity, layered with societal resilience indicators: infrastructure quality, education levels, income, hospital beds per capita, and labor market momentum.
Pockets of resilience appear where the underlying distress map would suggest none should exist. Florida is the canonical example. Headline narratives treat the state as a single bet; the data treats it as two. The Atlantic coast remains structurally resilient on most metrics, while the Gulf Coast is absorbing the brunt of insurance repricing and infrastructure stress. We made that call early on Cape Coral against Florida’s COVID-era consensus, and the market eventually agreed.
The locations that read red in Map 2 and disappear in Map 3 — high risk, weak population growth, low adaptation capacity — are the genuine long-term decline candidates.
Map 4: Where Growth Is Most Likely to Outpace the Rest
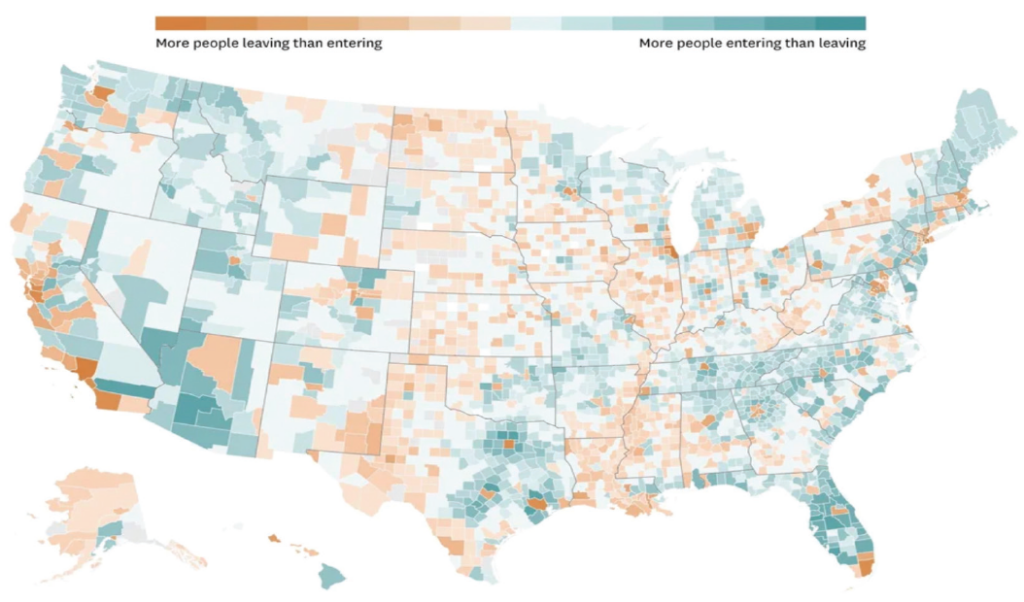
The fourth map is a climate-adjusted, county-level forecast of above-trend population growth over the next five to ten years. We started from NASA SEDAC’s SSP2 demographic baseline and overlay AlphaGeo’s flood-driven migration model, conditioning the baseline with our scoring of labor markets, greenfield investment, climate risk, predicted insurance premiums, and zoning flexibility.
Climate risk matters — but it does not move every market in one direction. While roughly 40% of flood-prone areas are expected to decline, another 20% are expected to grow despite the risk, due to a confluence of capital, infrastructure, and labor opportunities. The most concentrated micro-hubs of above-trend growth sit in the Rust Belt: Columbus, Ohio; Des Moines, Iowa; and several peers, where deep-tech infrastructure, educated workforces, interstate logistics, broadband and data center power, and housing affordability are converging.
Map 5: Site Selection in the Age of AI via Alpha Finder
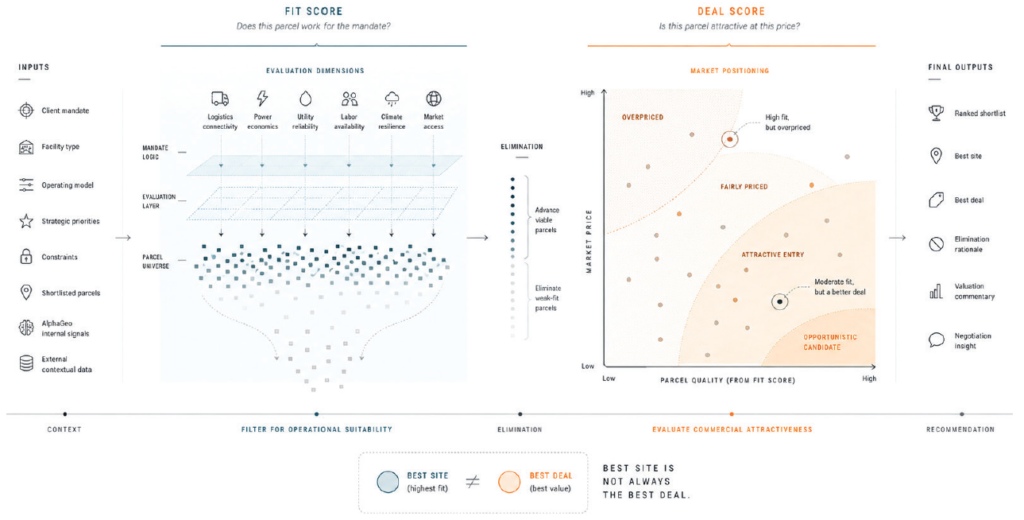
The final map is, in fact, not a map but a workflow to define high-conviction investment opportunities.
It is an AI-assisted site selection and underwriting tool that runs every candidate location through two stages. The Fit Score screens parcels against climate, infrastructure, regulatory, and labor constraints to eliminate unviable sites before any pricing exercise begins. Sites that pass Fit go through a Deal Score that evaluates market fundamentals, operating costs, and forward growth potential, anchored to a fair-market reference price. The output is a Fit-versus-Deal matrix that sorts a portfolio cleanly into overpriced trophies, fair-market holds, and opportunistic entries.
AI is collapsing the lag between what is happening on the ground and what investors can see, which is good for everyone and an unalloyed gain for the industry. But it will not eliminate the premium that accrues to being predictive rather than reactive. That premium comes from holding wide data together — and finding correlations across market, macro, demographic, and environmental signals that no single source surfaces.
In a complex system, equilibrium is an illusion. The forces driving the next decade of US real estate — reindustrialization, regionalism, demographic compression, climate-and-insurance repricing — are not converging on a new steady state, but reinforcing each other in motion. Resilience, properly quantified, is one of the only theses durable enough to ride that.