Semiconductor manufacturing is among the most resource-intensive and geographically concentrated industrial sectors in the world. The global semiconductor industry generated $627.6 billion in sales in 2024, on track to exceed $1 trillion by 2030— but that growth trajectory carries an underappreciated vulnerability: physical climate risk.
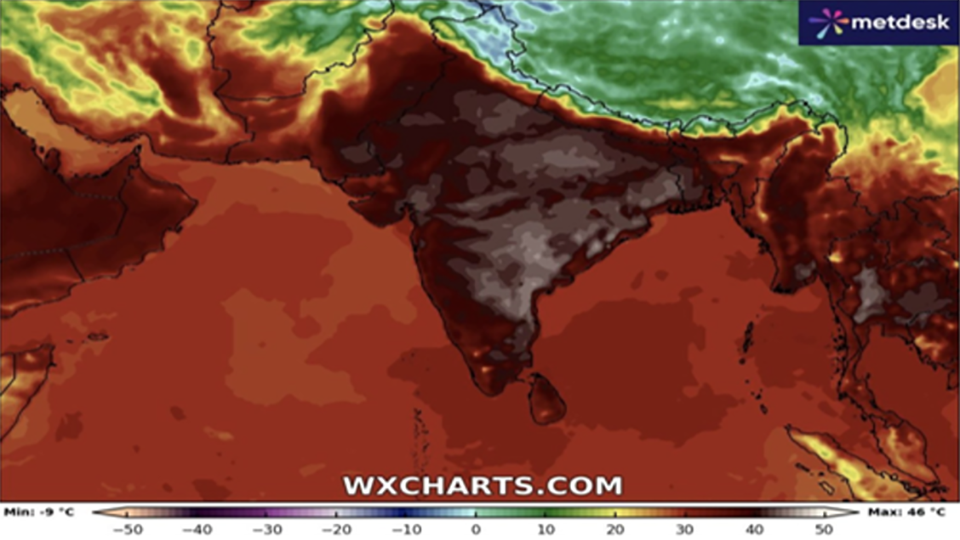
The exposure is already visible. In 2021, a severe drought in Taiwan — home to over 90% of the world’s most advanced chip capacity — forced fabs including TSMC to truck in water from distant reservoirs to maintain production, prompting a government-declared water emergency across the island’s semiconductor corridor. It was a warning: in an industry built on ultrapure water consumed at millions of gallons per day, climate-driven water stress is a direct threat to fab uptime.
For an industry where a single facility shutdown can cost hundreds of millions and cascade across global supply chains within days, climate exposure is no longer a background condition — it is a financial and operational risk.
This report analyzes the physical climate risk and financial impact of 555 US semiconductor facilities under the Medium Emission SSP3-7.0 scenario at mid-century (2045–2050) horizon. We analyze these facilities for their:
- Climate risk and resilience: Risk exposure (both mitigated and unmitigated) across 9 hazard types.
- Financial impact: Projected climate-driven changes in insurance costs, retrofit costs, operational downtime, and efficiency losses, amongst others.
Key takeaways
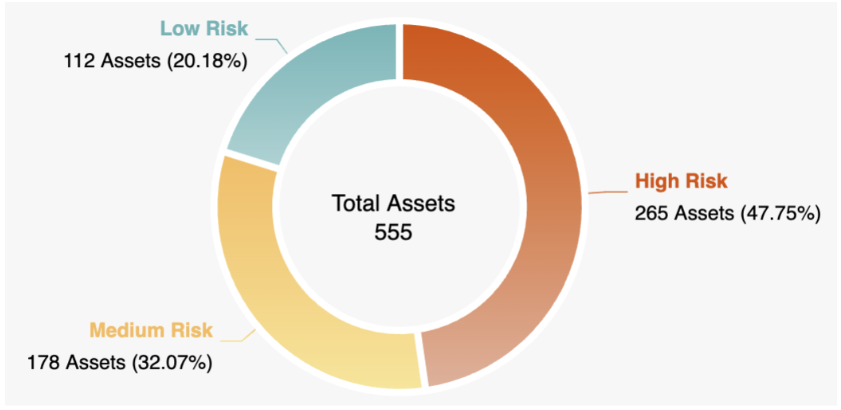
- Nearly half of all US semiconductor facilities face high climate risk by mid-century, including half of all Production assets. Under a medium emissions scenario, 47.7% of the 555 facilities assessed are classified High Risk by 2045–2050 — among them, 102 of 213 foundries, materials plants, and equipment manufacturers where physical risk translates directly into operational disruption and global supply chain cascades.
- Heat stress is the defining hazard. It affects more assets than any other risk driver — 257 across the full portfolio, 150 in Production assets alone — with annual maximum temperatures projected to reach 38.8°C and 28 days above 35°C per year by mid-century.
- The financial exposure is broad and quantifiable. 63% of assets face high utility cost impact. Retrofit capex affects 42%. Operational downtime affects 1 in 3 assets at high impact.
- Concentration risk is acute. Five metro clusters — Phoenix, Silicon Valley, Austin, Portland/Hillsboro, and the Research Triangle — account for the majority of US semiconductor exposure.
Methodology
Data Sources
Facility data is sourced from the Semiconductor Industry Association (SIA) US Ecosystem Map. Risk scores are derived from AlphaGeo’s Climate Risk & Resilience Index (CRRI) and Financial Impact Analytics.
Scenario and time horizon
This report uses the SSP3-7.0 (Medium Emission) scenario projected to 2045-2050, the mid-century horizon most relevant for current asset investment and planning decisions.
Resilience-adjusted risk Framework
Our analysis employs AlphaGeo’s proprietary Resilience-adjusted Risk methodology, delivering a nuanced and more accurate depiction of “ground truth” risk:
- Physical Climate Risk: Gauges a location’s risk profile based on physical climate risk factors (e.g., temperature, precipitation, water stress, etc).
- Resilience-adjusted Risk: Provides a more accurate assessment of “real-world” risk by adjusting for the impact of local adaptation on location risk.
Full details of our hazard modelling and resilience-adjustment methodology can be found here.
Scoring Methodology
Each asset is given two set of scores
- Overall scores: i.e., the Overall Physical Climate Risk Scores and Overall Resilience-adjusted Risk Scores, which are global percentile scores measuring the overall risk profile of a location in comparison to other locations — enabling like-for-like comparison and benchmarking
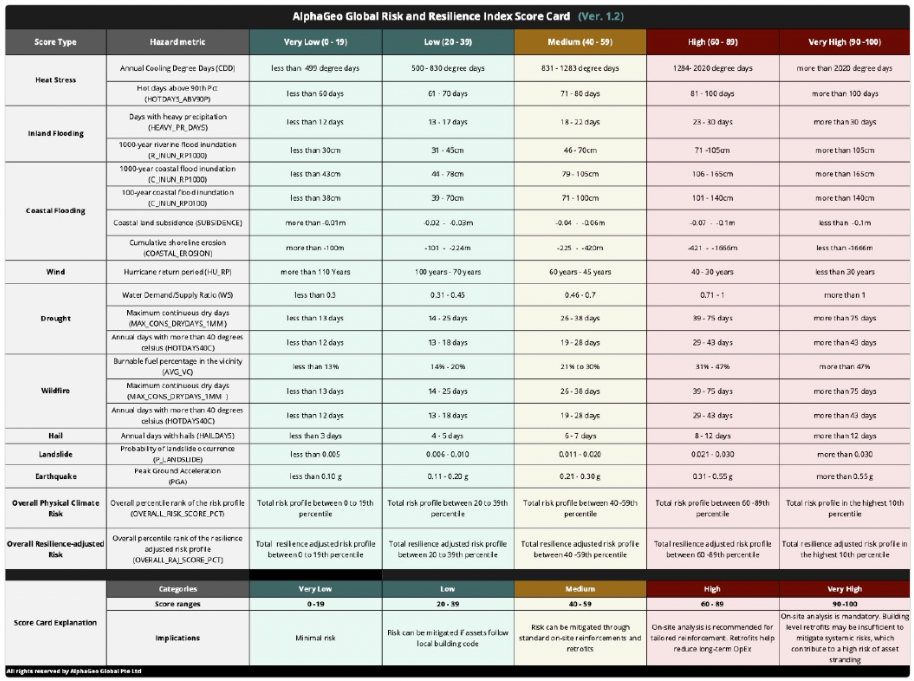
- Hazard-specific scores: Scores are based on the absolute risk exposure of a location for any given type of risk on a scale of 0-100. Category breaks (i.e., Very Low, Low, Medium, High, and Very High) are based on the Mean Damage Ratio defined for each of the hazard’s specific risk features.
Score categories are described in the scorecard below:
Financial Impact Analytics
AlphaGeo’s Financial Impact Analytics (FIA) toolkit quantifies the direct financial effects of climate change, including changes in insurance premiums, retrofit costs, operational downtime, operational efficiency, and discount rates.
1. Resilience-adjusted physical risk insights
Overall risk
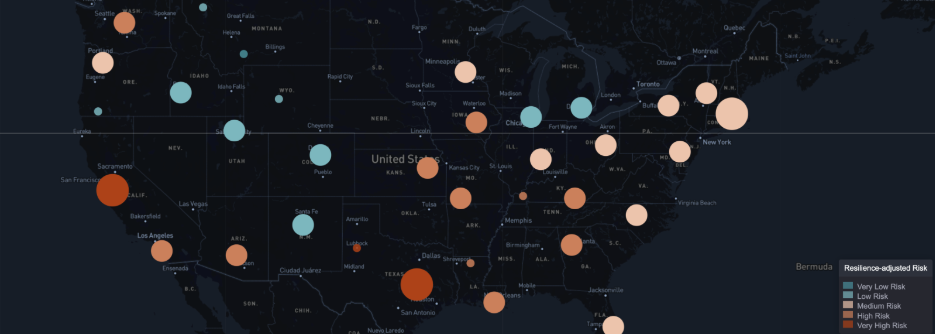
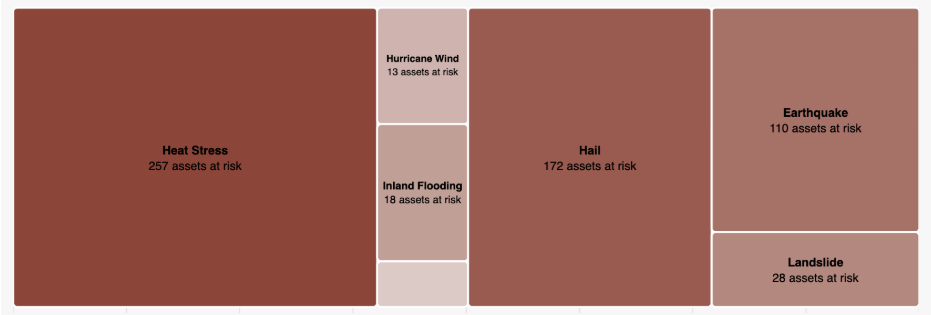
Under the medium emissions scenario at mid-century (2045-2050), 47.7% of US semiconductor facilities are classified as High Risk.
This is driven primarily by heat stress, which affects 257 assets and is concentrated in the Phoenix, Austin, and Silicon Valley clusters. Earthquake and hail risk account for a further 110 and 172 assets respectively, concentrated in the Bay Area, Portland/Hillsboro, and Central Texas corridors.
Risk by hazard type
Heat stress is the dominant hazard across the portfolio at mid-century; 257 assets are exposed.
For Production-sector assets (fabs, materials, equipment), the consequences are direct and operational. Fabs require precisely controlled cleanroom temperatures and consume enormous quantities of cooling water – both threatened by rising heat. Higher temperatures mean higher energy costs, greater cooling water demand, and increased risk of equipment operating outside thermal tolerance, translating into reduced throughput and unplanned downtime.
Hail affects 172 assets and earthquake affects 110, both driven by geography. Drought, flooding, and wildfire affect smaller subsets of the portfolio.
Risk by geography
Arizona and California account for the highest concentration of at-risk semiconductor assets. The Phoenix cluster (TSMC, Intel, NXP, Microchip Technology) faces compounding heat and water stress across both manufacturing and design operations. The Bay Area cluster (Lam Research, Applied Materials, KLA) combines critical equipment manufacturing with R&D facilities, facing seismic and wildfire exposure.
Deep-dive: Risk and Financial Impact for Production Assets
The 555 facilities are classified into 2 sectors: Production (213 Industrial facilities — foundries, IDMs, materials, equipment, OSAT) and Innovation (342 Commercial facilities – fabless design, IP & EDA, universities, research institutes).
The following section is a deep-dive into Production assets, as these face direct physical climate risk – these are the fabs, the materials plants, the equipment manufacturers.
Production sector – Resilience-adjusted risk profile
Production sector risk by hazard type
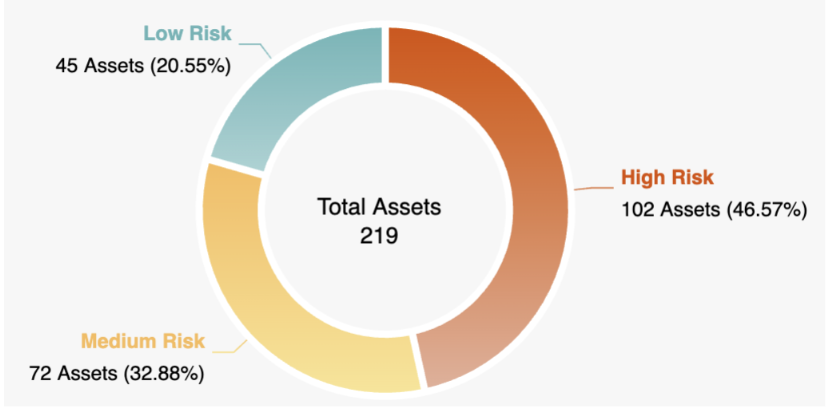
Nearly half of all Production-sector assets are classified as High Risk by mid-century — 102 of 219 facilities. The Production sector scores 51/100 overall on Resilience-adjusted Risk, more than the Innovation sector, reflecting the higher physical hazard intensity of manufacturing locations.
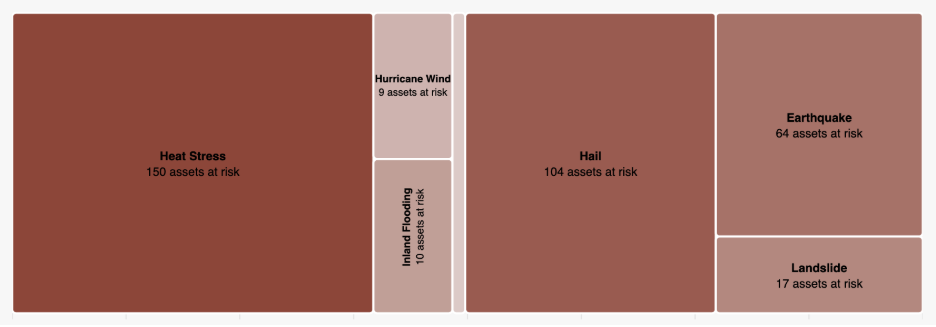
Heat stress is the dominant hazard, affecting 150 assets — with annual maximum temperatures projected to reach 38.8°C at mid-century and days above 35°C rising to 28 per year across the cluster average. Hail affects 104 assets and earthquake 64 – both static exposures driven by geography.
For manufacturing facilities, heat stress is a direct operational threat — fabs require precisely controlled cleanroom temperatures and enormous quantities of cooling water, both threatened by rising heat, driving up energy costs and increasing the risk of unplanned downtime.
Materials suppliers and equipment manufacturers represent underappreciated upstream chokepoints — a single disruption cascades immediately into fab operations globally.
2. Financial impact insights
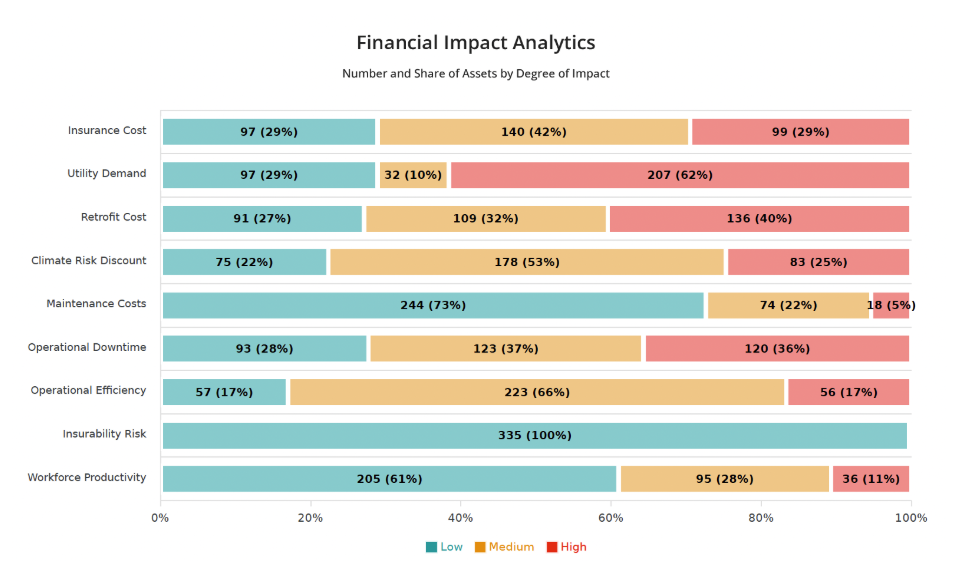
AlphaGeo’s Financial Impact Analytics quantify physical risk exposure across 9 financial metrics, spanning operating expenditure, capital expenditure, income, and cost of capital. Utility demand increases represent the broadest exposure in the portfolio — 63% of assets face high impact, driven by rising cooling and energy costs as heat stress intensifies across the semiconductor manufacturing base. Retrofit costs affect 42% of assets at high impact, reflecting the capital requirement to harden facilities against escalating physical hazards.
Operational downtime affects 33% of assets at high impact — a material risk for manufacturing facilities where unplanned shutdowns carry costs in the hundreds of millions and recovery timelines measured in weeks, not days.
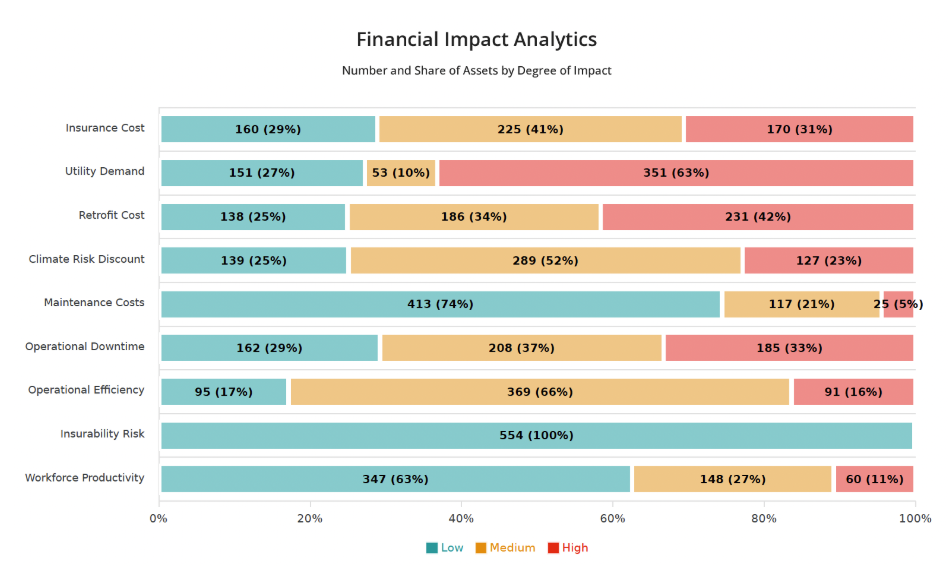
Insurance cost escalation is more concentrated but produces the most severe individual asset outcomes. 31% of assets face high insurance cost impact, with the most exposed facilities — concentrated in coastal California and the Carolinas — facing 13–15%+ annualized premium increases. Climate risk discount rate increases affect 23% of assets at high impact, reflecting the cost of capital implications of elevated physical hazard exposure — a metric of direct relevance to asset financing and long-term valuation.
Insurability risk currently scores Low across 100% of the portfolio — but as physical hazard exposure compounds over the investment horizon, coverage availability and pricing represent a forward risk that is not yet fully reflected in asset valuations.
Deep-dive: Production Sector Financial Impact
For Production sector assets, utility demand increases represent the broadest exposure — 62% of Production assets face high impact, driven by rising cooling and energy costs as heat stress intensifies across manufacturing facilities in Phoenix, Silicon Valley, and Central Texas.
Retrofit costs affect 40% of assets with high impact, reflecting the capital requirement to harden fabs, materials plants, and equipment facilities against escalating physical hazards.
Operational downtime affects 36% of assets at high impact — the most material financial risk for manufacturing facilities, where unplanned shutdowns carry costs in the hundreds of millions and recovery timelines measured in weeks.
Notable outliers on insurance cost escalation include Infineon Chandler (+13.4%), Qorvo (+13.3%), and EUV Tech (+12.0%) — facilities whose combined seismic, thermal, and coastal exposure drives disproportionate premium escalation relative to the broader manufacturing base.
Across both sectors, utility demand increases, and retrofit costs emerge as the defining financial exposures — affecting the majority of assets regardless of whether they manufacture chips or design them.
Conclusion
The US semiconductor ecosystem faces a material and escalating set of physical climate risks – concentrated in geographies already under heat and water stress. Financial consequences – in insurance, retrofit capital, and operational downtime – are already measurable. Embedding climate considerations into site selection, operational planning, and supply chain risk frameworks is a necessary step for any owner, operator, or investor with exposure to the US semiconductor supply chain.
To learn more, visit alphageo.ai or contact [email protected]
Disclaimer
This report is provided for informational purposes only and is not for redistribution, resale, or sublicensing. AlphaGeo analytics are intended for internal decision support and may be shared with clients but not commercialized without AlphaGeo’s prior written consent.
References
- Semiconductor Industry Association (2026). US Semiconductor Ecosystem Map. semiconductors.org/ecosystem.
- AlphaGeo (2026). Climate Risk & Resilience Index (CRRI). Methodology v1.3. docs.alphageo.ai.
- AlphaGeo (2026). Financial Impact Analytics. Methodology. docs.alphageo.ai.
- IPCC (2021). Sixth Assessment Report: Climate Change 2021: The Physical Science Basis. Cambridge University Press.