Introduction
New research highlighted by The New York Times shows how rapidly rising home insurance costs are reshaping local housing markets. In many states, premiums have increased 70–144% since 2014. Researchers have also found that since 2018, homes in ZIP codes most exposed to hurricanes and wildfires have sold for an average of $43,900 less than they would otherwise.
This validates what we’ve long argued at AlphaGeo: climate risk will become increasingly priced into home values through insurance premiums and the growing challenge of insurability.
Against the backdrop of this emerging research, this edition of Climate Finance 101 looks at how AlphaGeo models Insurability Risk and Insurance Cost Impact to help real estate investors, owners, and operators manage the growing challenge of climate-drive insurance volatility.
The Macro View: Latest Findings on Climate-driven Insurance Risk
Climate change is fundamentally reshaping insurance risk for homeowners and real estate investors across the U.S. New research highlighted in the New York Times points to four data-backed trends:
1. A Climate-driven Insurance/Reinsurance Shock
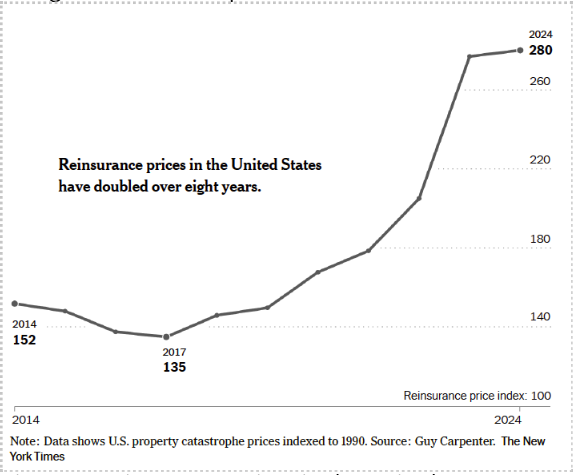
An analysis of 74 million home payments found that rapid repricing of disaster risk has been responsible for about one-fifth of overall home insurance increases since 2017. This shift is driven in part by what researchers call a “climate epiphany” in the reinsurance market, where reinsurers have roughly doubled the rates charged to insurance providers.
2. Premium Spikes
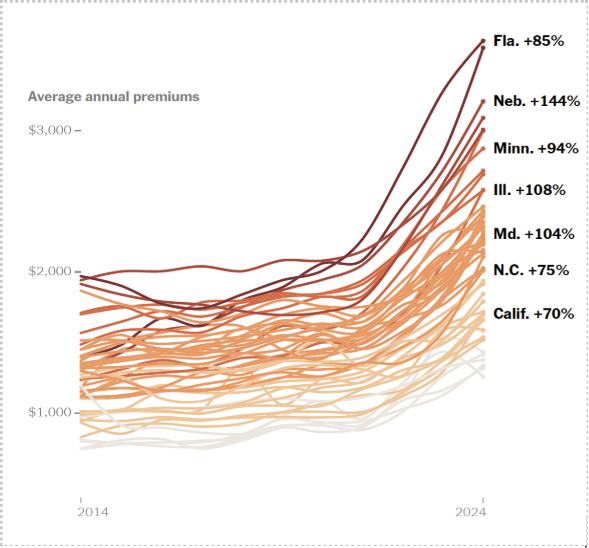
Insurance premiums in risk-prone states have surged dramatically as a result. In wildfire- and hail-prone Colorado, the average premium has more than doubled in the past decade, with median premiums rising 74% since 2020.
More broadly, Florida, Nebraska, Minnesota, Illinois, and Maryland have all seen premiums jump 70–144% in ten years—a reflection of both escalating physical risks and the insurance sector’s reduced capacity to absorb them.
3. Affordability Ceiling
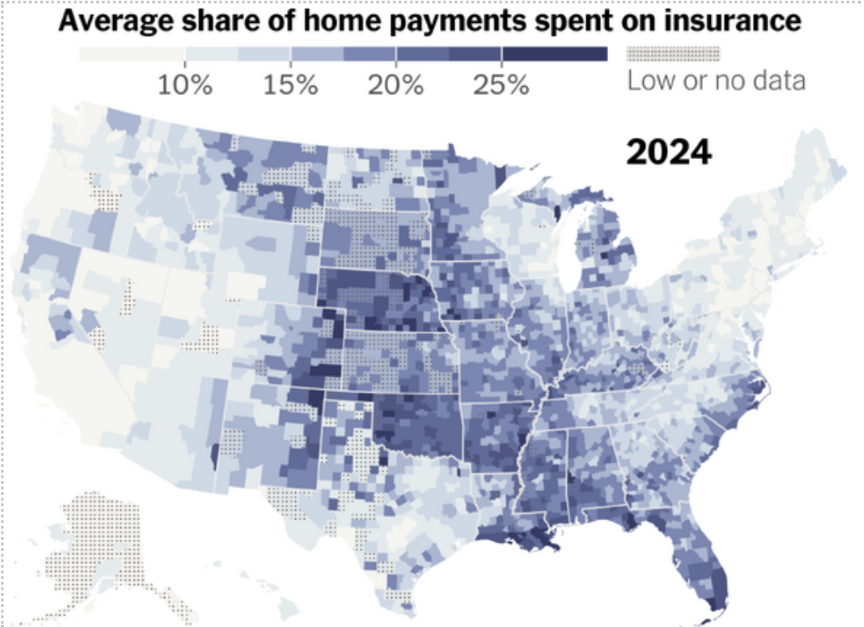
Rapidly rising premiums are consuming a growing share of homeowners’ monthly payments.
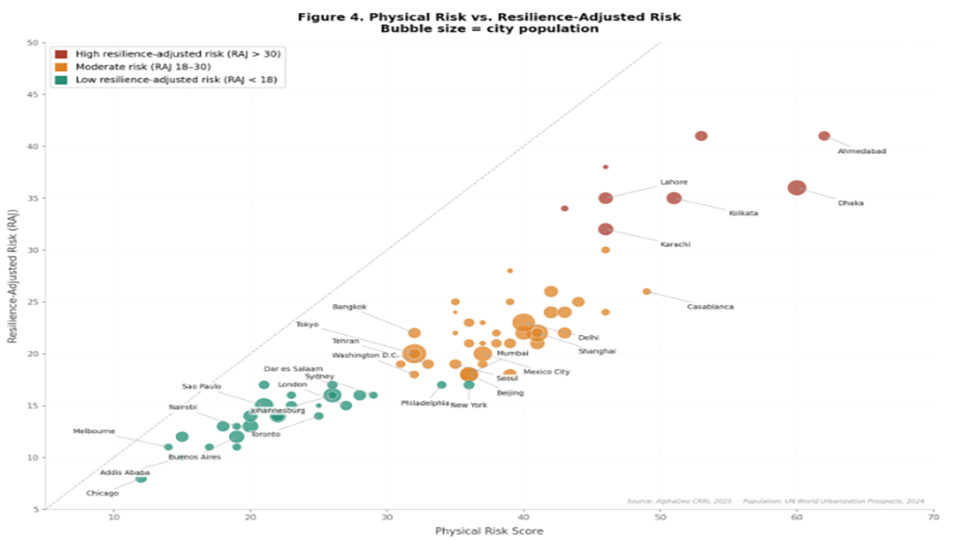
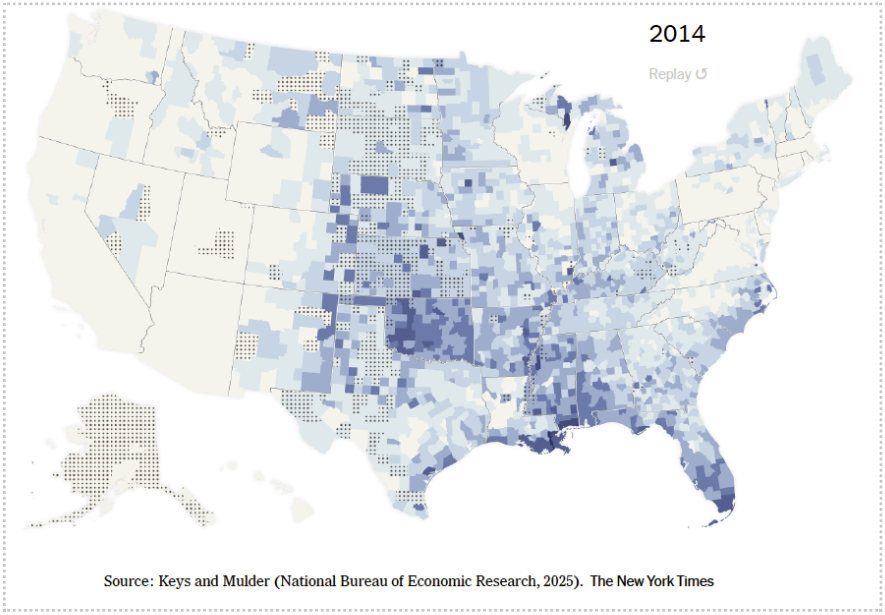
Figures 4 and 5 below show significant increases in insurance’s share of home payments between 2014 and 2024.
3. Valuation Drag
While there are factors beyond insurance that affect local home prices, troubling signs of insurances’ valuation drag are already beginning to emerge in some markets. Research on tens of millions of housing payments indicate that since 2018, homes in zip codes most exposed to hurricanes and wildfires sell for an average of $43,900 less than they would otherwise. Researchers also found that the reinsurance shock reduced 2023 home values by $8,400, with the capitalization of premiums into home prices even stronger where climate risk is growing.
How AlphaGeo Measures and Models Impact
These trends make clear why investors need to start thinking about insurance impact on valuations today. Yet most lack reliable, forward-looking data to support such modeling. This is why we’ve developed not one but two complementary metrics on insurance impact: Insurability Risk (availability) and Insurance Cost (affordability and valuation pass-throughs).
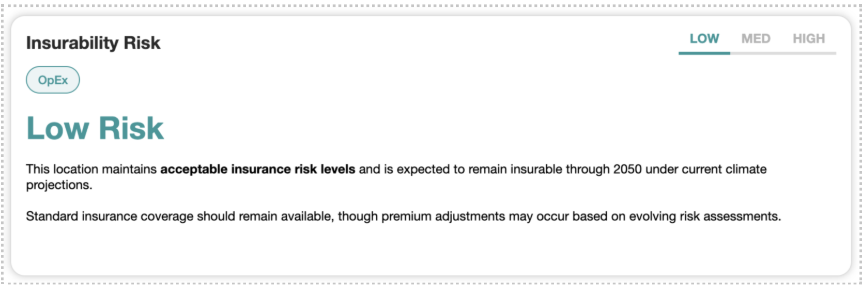
1. Modeling Insurability Risk (Binary)
We assess whether insurance coverage will likely remain available by benchmarking a location’s future risk against current market tolerance.
We start by analyzing today’s insurance market to identify the maximum level of risk insurers are still willing to underwrite. If projected 2050 climate risk for a location exceeds the 99th percentile of risk currently accepted by insurers, we designate that location as having High Insurability Risk.
This signals where coverage may be withdrawn entirely, leaving assets effectively uninsurable.
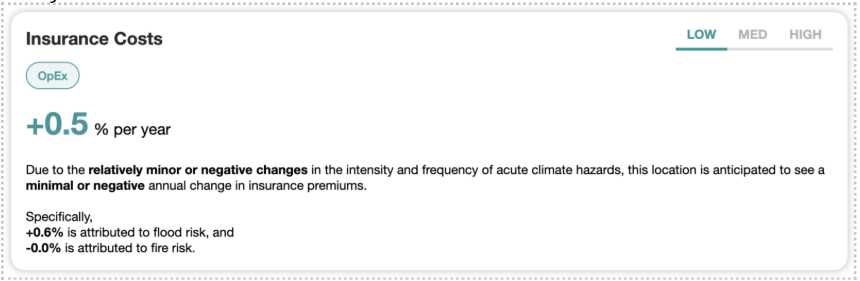
2. Modeling Insurance Cost Impact (Continuous)
Where coverage remains available, it is likely to become significantly more expensive in locations where risks are projected to increase.
Our Insurance Cost Impact metric models future changes in:
- Mean Damage Ratio (MDR)
- Insurer Loss Ratios over time
We calculate MDR using damage functions that map hazard intensity (e.g., flood depth, wind speed) to expected asset-level losses.
(Note: For a deeper dive, see our earlier article: “Climate Finance 101: How Will Climate Change Impact Insurance Premiums”?)
Why This Matters
Climate-driven insurance volatility is now a core financial risk. When insurers withdraw or sharply reprice coverage in high-risk regions, physical climate risk directly influences asset demand, cost of capital, and valuation. This is why AlphaGeo clients are integrating climate-adjusted insurance cost assumptions into financial planning, underwriting, and strategic decision-making.
For ESG and sustainability teams, these metrics – alongside its transparent and explainable methodology – help translate climate risk into financially relevant indicators that resonate with investment, operations, and asset management teams, enabling cross-functional collaboration for climate resilience.
Our metrics are already being used for:
- Valuation and investment analysis: Incorporating premium projections into returns modeling and scenario analysis
- Financial planning and analysis (FP&A): Adjusting OpEx assumptions for rising insurance costs
- Market analysis and site selection: Assessing how insurance costs—and insurability constraints—affect location attractiveness and long-term demand.
Learn More
To explore how AlphaGeo’s Financial Impact Analytics can help you forecast insurance volatility across your portfolio, visit alphageo.ai or contact our team at [email protected].
Ready to see the data? Start your free trial here.