When it comes to climate and data centers, the conversation has long focused on the sector’s significant contributions to carbon emissions. But there is a critical blind spot that operators, investors, and developers can no longer afford to ignore: the physical climate risks threatening data center operations.
AlphaGeo’s latest analysis explores this often-overlooked dimension. We evaluate the physical climate risks confronting over 9,000 data centers globally, pinpoint the hazards posing the greatest threats, and offer guidance on how operators can adapt — both for existing infrastructure and future site selection.

➤ How is risk assessed?
Scenario and Time Horizon
This report assessed over 9,000 data centers worldwide across six major hazard types utilizing the SSP5-8.5 (High Emissions) scenario, projected to 2050 to approximate the likely working life of current and upcoming (planned, or in construction) data centers.
- Heat Stress
- Drought
- Coastal Flooding
- Hurricane Wind
- Wildfire
Resilience-adjusted Risk Framework
Our analysis employs AlphaGeo’s proprietary Resilience-adjusted Risk methodology, delivering a nuanced and more accurate depiction of “ground truth” risk:
1) Physical Climate Risk: Gauges a location’s risk profile based on physical climate risk factors (e.g., temperature, precipitation, etc.).
2) Resilience-adjusted Risk: Provides a more accurate assessment of “real-world” risk by adjusting for the impact of local adaptation on location risk.
Full details of our hazard modelling and resilience-adjustment methodology can be found here.
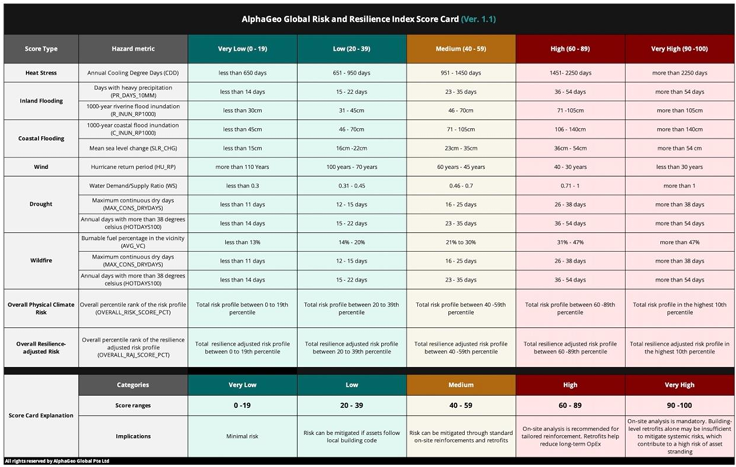
Scoring Methodology
Each asset is given two set of scores
1) Overall scores: i.e., the Overall Physical Climate Risk Scores and Overall Resilienceadjusted Risk Scores, which are global percentile scores measuring the overall risk profile of a location in comparison to other locations — enabling like-for-like comparison and benchmarking
2) Hazard-specific scores: Scores are based on the absolute risk exposure of a location for any given type of risk on a scale of 0-100. Category breaks (i.e., Very Low, Low, Medium, High, and Very High) are based on the Mean Damage Ratio defined for each of the hazard’s specific risk features. A detailed score card is available in the report Appendix.
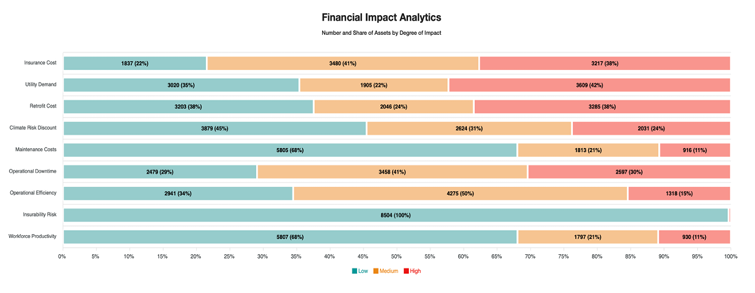
Financial Impact Analytics
AlphaGeo’s Financial Impact Analytics translate climate risk into its tangible financial impacts, addressing the “so-what” of climate risk. We model the impact of climate scenarios on annualized changes in:
- Insurance Premiums
- Utility Demand
- Retrofit Costs
- Discount Rates
- Operational Downtime
- Operational Efficiency
- Workforce Productivity
- Maintenance Cost
- Insurability Risk
These metrics cover income, OpEx, CapEx, and discount rates, and can be plugged into existing financial frameworks (e.g., discounted cashflow analyses), integrating climate risk into the underwriting or financial planning process.
Full methodological details can be found here.
➤ Proportion of data centers at risk
Using this framework, around 20% of global data center assets face medium-to-high risk when adjusted for local resilience. The charts below illustrate the distribution of data centers across high, medium, and low physical climate risk levels for acute and chronic hazards, with and without resilience adjustments.
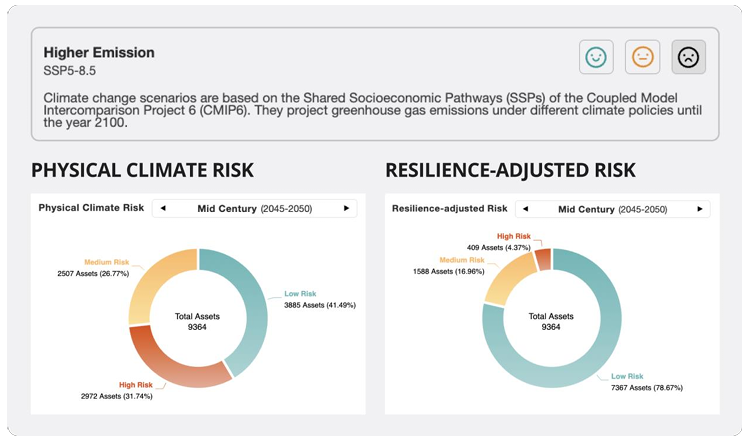
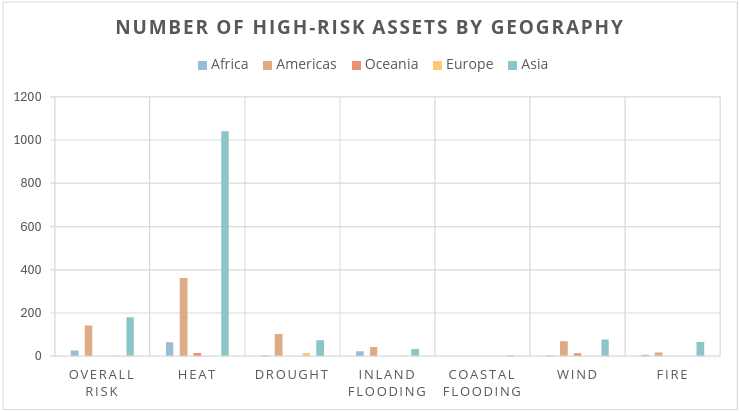
➤ Physical risks by hazard type
Data centers are most vulnerable to heat stress, drought, followed by inland flooding, after adjusting for local adaptation measures. This differs from a purely physical risk perspective, where inland flooding poses the most significant threat.
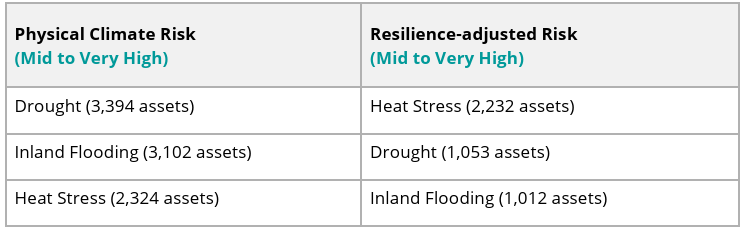
Over 2,000 data center assets have moved from moderate-to-very-high flood risk to a low-risk category, suggesting the presence of effective local flood resilience measures. In contrast, heat stress remains a persistent and less-addressed challenge. Despite its direct impact on cooling efficiency, energy demand, and operational reliability (including risks such as overheating, equipment failure, and unplanned outages), proactive adaptation to chronic heat appears limited.
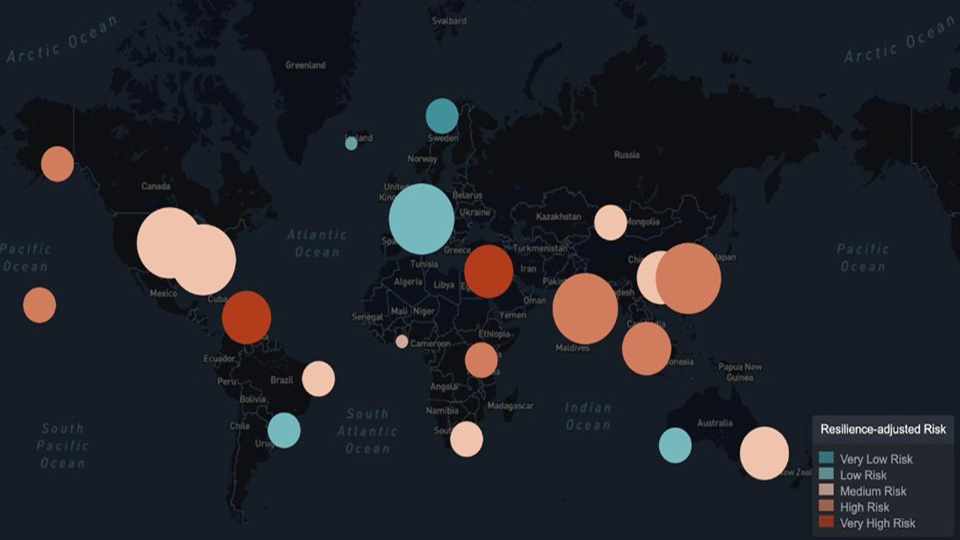
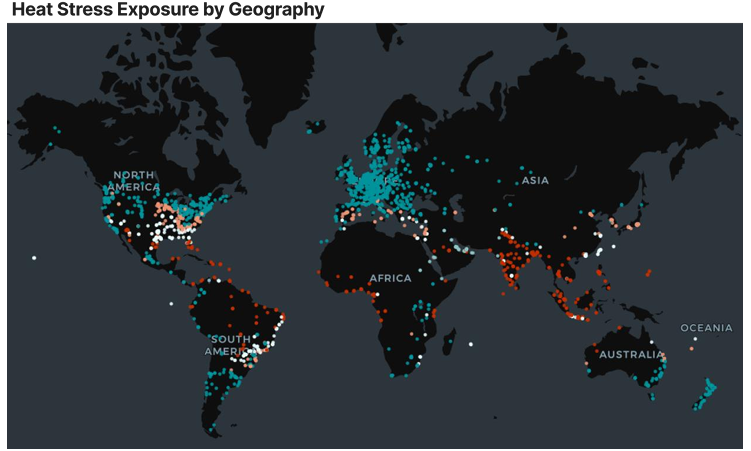
➤ Geographic risk concentration
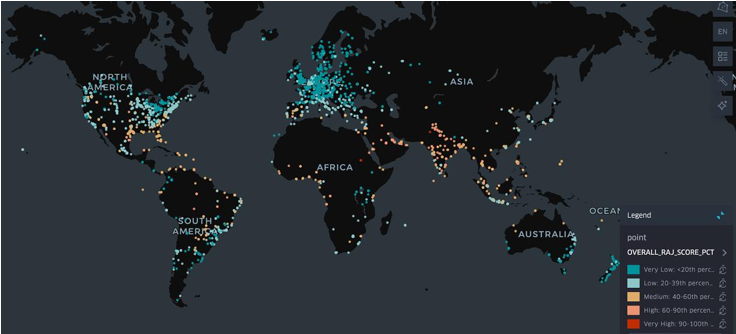
Asia, particularly the Middle East and South Asia (per UN regional classifications), exhibits the highest risk exposure across hazard types, with heat stress posing a particularly significant threat.
➤ Physical risks by operational status
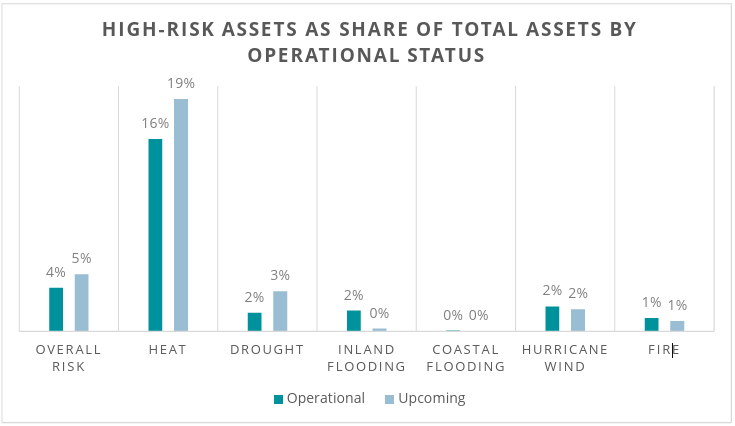
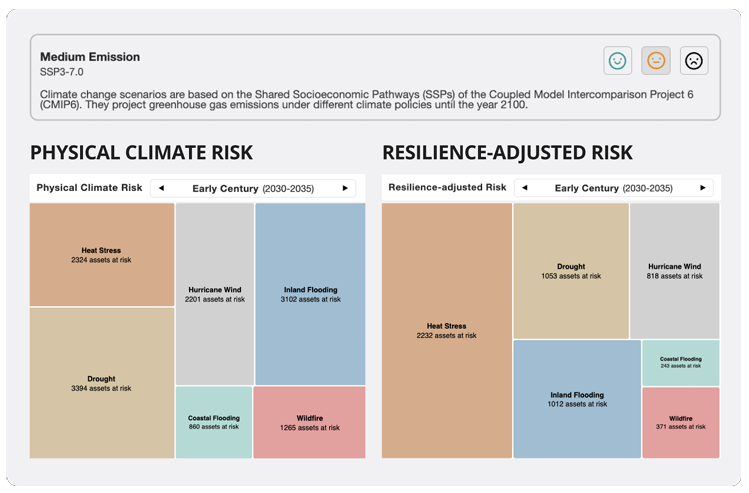
Despite growing awareness of physical climate risks, our analysis indicates that new data center developments (those under construction or in their planning phase) are nevertheless located in hotter, drier locations than before. While exposure to acute hazards like flooding and wildfire has decreased, exposure to chronic hazards such as heat and drought has increased. This trend may reflect broader regional industrial strategies or energy cost considerations, but it also raises important questions about long-term operational efficiency and water availability, especially for cooling systems.

Physical risk exposure affects more than operational resilience — it has direct financial implications. AlphaGeo’s Financial Impact Analytics suite quantifies these effects across four key indicators:
- Insurability Risk: The risk that an asset becomes uninsurable over time.
- Insurance Costs: Premium changes driven by elevated flood or fire risk.
- Utility Demand: Change in energy use due to higher cooling or heating requirements.
- Retrofit Costs: Capital expenditures required for thermal comfort, hurricane and flood defenses, and fire defenses.
- Climate Risk Discount: Increase in discount rate as a result of perceived climate risk.
- Maintenance Costs: Expenses incurred for additional upkeep and repairs from physical climate exposures.
- Operational Downtime: Lost revenue risk due to service interruptions caused by environmental events.
- Operational Efficiency: Reduction in the efficiency or maximum output of productive assets.
- Workforce Productivity: Impact on employee output and well-being from incidents or ongoing risk exposure.
Our results show that more than half of analyzed data centers are projected to experience high retrofit cost impact, with cost increases of 4-13.4% expected annually for this set of assets. Additionally, over 40% are expected to see a meaningful impact on insurance and utility demand. Operational downtime also emerges as a significant financial concern, with 30% of assets exposed to high levels of disruption — a major consideration for business continuity planning. While maintenance costs and workforce productivity impacts are comparatively relatively lower (11%), ongoing attention is necessary to address the impact of these drivers on the bottom-line (and worker welfare).
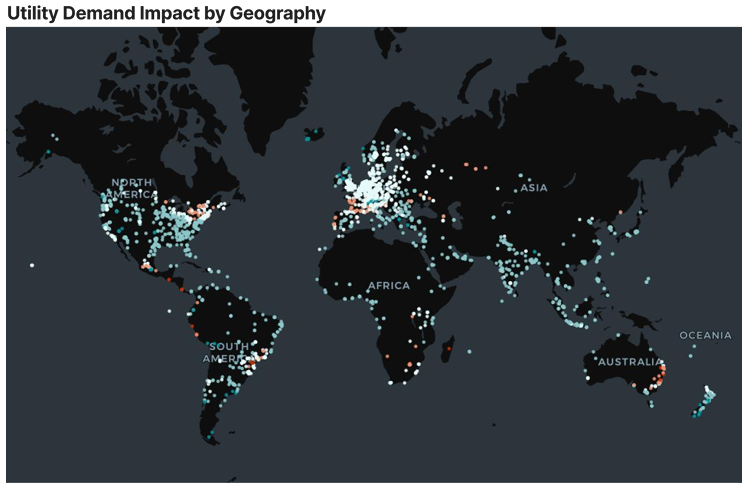
Importantly, it is the regions experiencing the greatest change in climate conditions — not just those with high absolute risk — that are likely to encounter more substantial financial impacts. Figures 7 and 8 illustrate that, despite significant heat stress exposure in the Middle East, South Asia, and parts of Latin America, changes in utility demand are expected to remain low. Data centers in these regions are likely already well-adapted to heat stress, experiencing minimal increases in cooling demand or retrofit costs. Conversely, data centers in temperate zones of the United States and Europe, which have relatively low-to-medium heat stress exposure, may face sharper increases in cooling demand and associated costs as their climate risk profiles evolve over time (even if their risk levels remain moderate compared to Middle Eastern locations). This underscores the importance of climate impact modelling, even for assets with relatively favorable risk profiles.

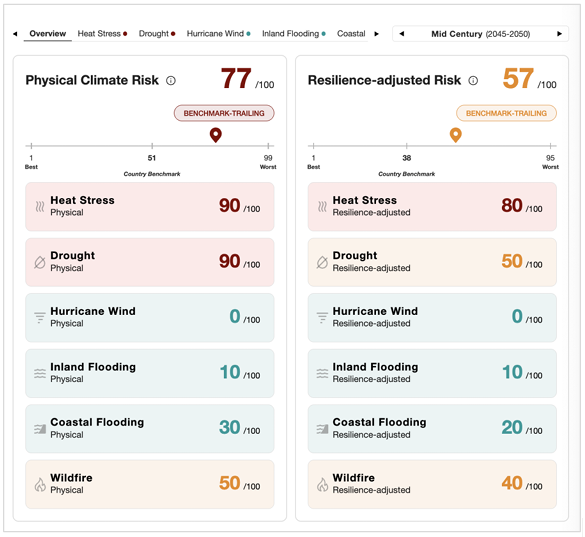
Data centers can strengthen their resilience to climate risks through asset-level and location-level adaptations. While site-specific design solutions are important, broader location characteristics also play a key role in managing long-term exposure. This analysis will focus on how location-level adaptations can help strengthen resilience to climate risks, leveraging AlphaGeo’s proprietary adaptation and resilience data. We highlight a data center in Luanda, Angola, which ranks among the most exposed to physical climate risks, with particularly high vulnerability to heat stress and drought. Based on the asset’s risk profile below, the operator may wish to delve deeper into heat stress and drought, both scoring moderate-to-high on a resilience-adjusted basis.
Users on our platform can explore specific hazards to identify adaptation gaps by utilizing our underlying Resilience data features (Figures 10 and 11).
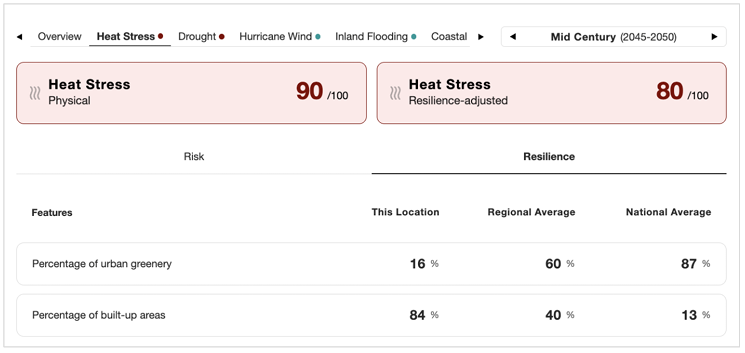
For instance, this asset’s resilience data for heat stress (Figure 10) reveals an opportunity to reduce surface temperatures through surrounding greenery, as the location’s greenery percentage is significantly below regional and national averages. Space-constrained data centers can also adopt asset-level solutions like green roofs and walls.
Greenery mitigates heat stress by providing shade, lowering surface temperatures, and enhancing air quality through evapotranspiration, where plants release water vapor to cool the surrounding area. Trees and vegetation absorb solar radiation, reducing the urban heat island effect, which can otherwise significantly elevate temperatures.
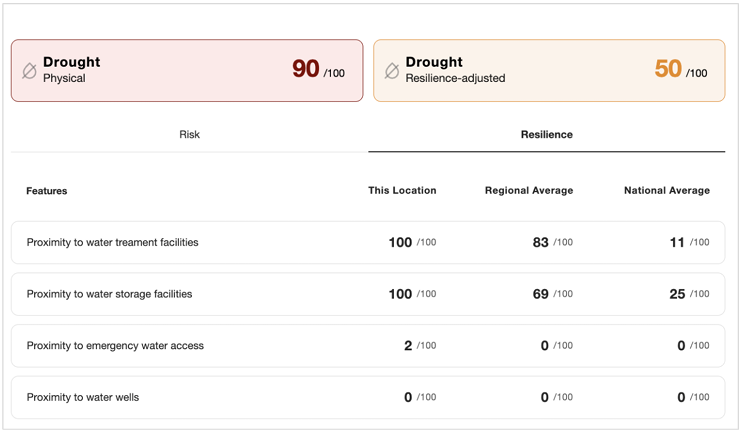
This asset is also located in a water-stressed region with high drought risk exposure. Our data (Figure 10) shows that while the asset benefits from proximity to water treatment and storage facilities, its resilience could be further enhanced by improving access to emergency water supplies (e.g., proximity to water distribution amenities during crises, such as water points) and incorporating water wells to access underground water during reduced freshwater availability.

While climate risk highlights areas to avoid, the critical question remains: where should data centers expand? Future-proof site selection must integrate climate risks alongside traditional site selection factors essential to data centre viability, such as land prices, grid capacity, and the costs of key inputs like electricity.
To address this challenge, we developed the Industrial Dynamism Signal, a composite index designed to assess location readiness for industrial and infrastructure investments, including data centers. A location’s overall Signals score is derived from four sub-indicators:
- Logistics: Measures the quality of physical infrastructure that enables the efficient movement of goods, including highway, rail, and air connectivity, as well as energy resilience through micro-grid capacity.
- Workforce Accessibility: Assesses the health, size, and suitability of the local labor market for industrial employers.
- Operational Efficiency: Quantifies key input costs and infrastructure quality factors that directly impact an industrial tenant’s profitability, such as electricity rates, grid reliability, and internet speed.
- Growth Potential: Identifies signals of future industrial expansion and innovation through our proprietary greenfield investment tracker, local patent activity, and our long-term climate risk score.
Our headline Industrial Signals scores enable users to compare locations across the United States for their suitability to industrial real estate investments, with underlying indicators and datasets available for customized analyses.
For data center-specific analysis, we emphasized Operational Efficiency and Growth Potential, which are most relevant to digital infrastructure. To do so, we selected locations in the top 70th percentile for overall Industrial Dynamism, Operational Efficiency, and Growth Potential. Recognizing that data centers rely less on Logistics or Workforce Accessibility compared to manufacturing or logistics hubs, we did not overweight these sub-indicators.
The analysis resulted in the following map of locations that could serve as desirable, climate-resilient data center sites of the future.
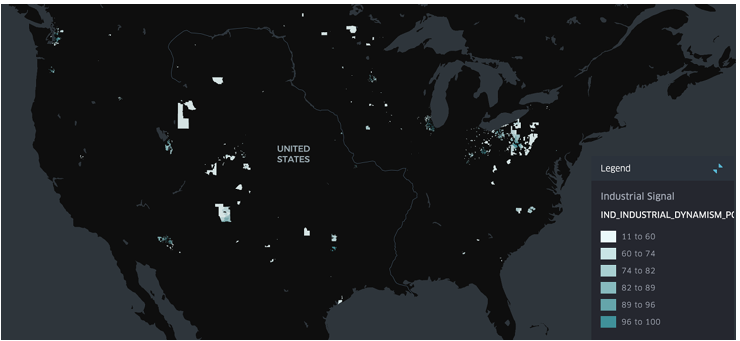
Clients can customize a high-level analysis like this through custom weightings of specific sub-indicators to align site screening with individual strategies. Full details of our Industrial Dynamism Signals product can be viewed here.

Climate risks are no longer a distant threat but a pressing reality for data centres worldwide. Our analysis reveals that hazards such as heat stress and drought can drive significant financial impact, even in temperate regions with moderate exposure. This effect stems primarily from the evolving risk profile of a location over time, rather than its absolute risk level, highlighting the urgent need for all data centre operators to enhance awareness of physical risks — even in areas that appear favourable today.
By integrating physical risk, adaptation, and resilience data into site selection and asset planning, operators and investors can better manage cost, performance, and long-term reliability. AlphaGeo’s analytics support this shift, offering robust tools to inform futureproof decisions amid climate volatility.
➤ Learn more
To learn more about our products and services, visit alphageo.ai or reach out to us at info@alphageo.ai. A free trial can also be accessed at app.alphageo.ai/trial_setup.