Summary
AlphaGeo’s Residential Dynamism Signal uses data science to identify US residential markets with strong economic vitality, livability, market performance, and growth potential. By combining traditional real estate indicators with forward-looking signals such as projected population change and climate resilience, AlphaGeo highlights markets that are not only attractive today, but also better positioned for long-term residential demand and investment opportunity.
Introduction
Where are America’s next hot residential markets — with strong economic drivers, exceptional livability and resilience to challenges such as climate risk?
Analysts spend hours scouring scattered sources for traditional data on permitting, job growth, demographics, and school ratings just to build a basic market view. Then there is the task of overlaying unprecedented new trends like rapidly shifting investment patterns, post-Covid migrations and spiking climate risks and insurance premiums — all of which are reshaping real estate value.
What if you could streamline the process of pinpointing high-conviction residential markets to just minutes? AlphaGeo’s newest tool – Location Dynamism Signals – does just that.
Where Are the Most Dynamic Markets Across the US?
AlphaGeo’s Signals quantify key drivers of housing market attractiveness based on four sub-indicators:
1. Economic Vitality: A dynamic local economy drives residential demand. We evaluate this through job growth, population growth, income growth rates, affordability metrics, and new business formation rates.
2. Livability: Quality of life is a key factor in location choice. This indicator measures neighborhood desirability through education levels, health outcomes, and access to amenities.
3. Market Performance: This indicator serves as a real-time gauge of the local real estate market, assessing transactional activity and supply-demand balance using metrics like price appreciation, days on market, and sale-to-list price ratios.
4. Growth Potential: This assesses factors shaping a market’s future trajectory, including residential building permits and our proprietary metrics such as long-term population projections and our climate resilience score.
The result is a comprehensive map highlighting America’s most attractive and resilient residential markets. A full product overview, including key underlying datasets, can be found here.

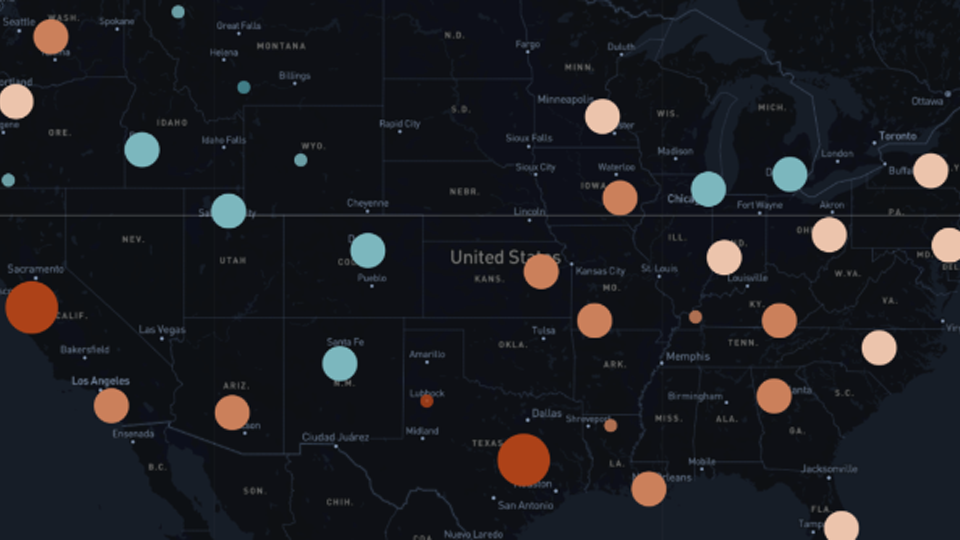
America’s Most Dynamic Markets
Our data reveals that the most dynamic locations tend to be:
Inland: Inland markets dominate over coastal regions, with strong activity concentrated in the south-central U.S., especially in the central and eastern Texas regions.
Metropolitan: These locations are heavily concentrated in major metropolitan areas. Overall, the top 10 regions by the number of CBSAs included are:
1. New York-Newark-Jersey City, NY-NJ
2. Los Angeles-Long Beach-Anaheim, CA
3. Chicago-Naperville-Elgin, IL-IN
4. Dallas-Fort Worth-Arlington, TX
5. Washington-Arlington-Alexandria, DC-VA-MD-WV
6. San Francisco-Oakland-Fremont, CA
7. Atlanta-Sandy Springs-Roswell, GA
8. Boston-Cambridge-Newton, MA-NH
9. Houston-Pasadena-The Woodlands, TX
10. Seattle-Tacoma-Bellevue, WA
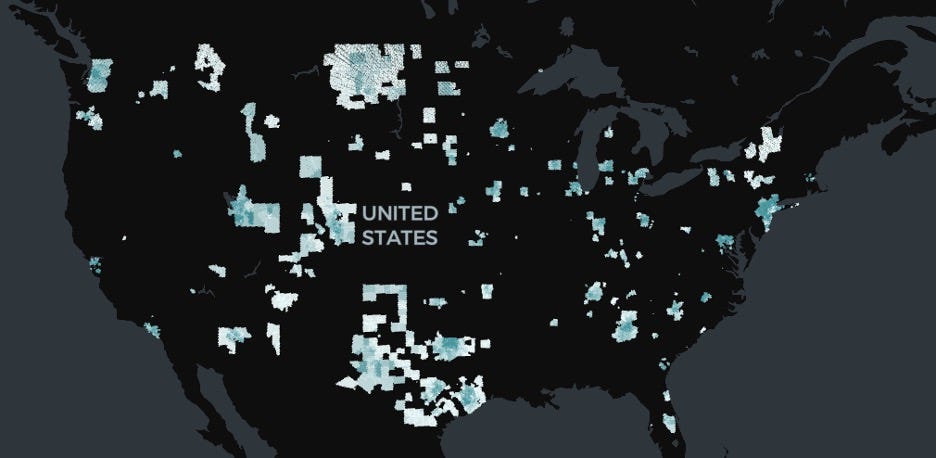
Cities with High Dynamism and High Growth Potential
To identify locations that have performed well historically and are poised for further growth, we filtered locations in the top 70th percentile based on their overall Residential Dynamism scores and Growth Potential sub-scores.
The Growth Potential sub-score is based on:
- Residential building permits: Indicating future housing supply and developer confidence
- Projected population change by 2050: A proprietary, long-term forecast of demographic tailwinds
- Climate risk and resilience: A proprietary score quantifying emerging climate havens set to grow as climate migration intensifies
Many of the same locations dominate, albeit with slight changes in ranking based on the number of locations in each region. The largest, most established metropolitan areas (New York, Los Angeles, Chicago, etc.) consistently exhibit high residential dynamism and continue to display strong growth potential.
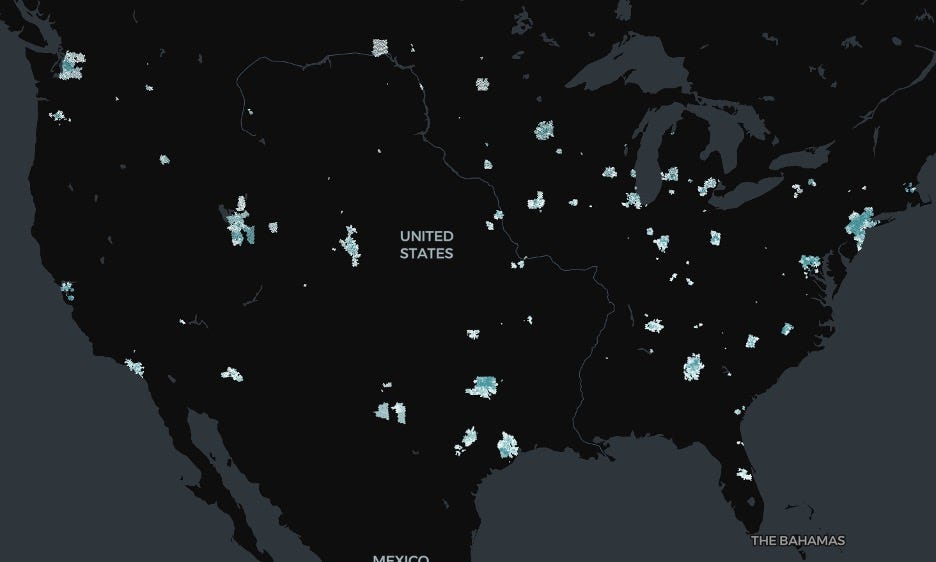
Emerging Markets with Strong Future Potential
That said, current market performance — quantified through variables such as price appreciation, days on market and sale-to-list ratios — may represent overheated conditions. Tomorrow’s opportunities may lie in markets with moderate performance but strong fundamentals and high growth potential.
To identify these emerging markets, we mapped locations with:
- High Residential Dynamism overall performance (70th percentile)
- High Growth Potential performance (70th percentile)
- High Livability performance (70th percentile)
- High Economic Vitality performance (70th percentile)
- Moderate Market Performance score (mid-range)
This filter removes overheated metropolitan areas, highlighting markets with strong fundamentals yet more balanced pricing. While New York and Los Angeles metros still appear, they are far less dominant than in Categories 1 and 2. And while large metros like Dallas, Atlanta, and Houston remain prominent (with some climbing in rank), it is dynamic, growing metros that stand out here — such as Sun Belt and Mountain West cities including Denver (CO), Charlotte (NC), Phoenix (AZ), Provo (UT), and Boise (ID).
Interested in learning more?
Create a free trial account to conduct your own analysis. Access detailed Location Dynamism Signals scores for specific locations beyond the high-level map views shown above.
Alternatively, schedule a demo with us today — simply reach out at [email protected].